Exam 12: Experimental Design and Analysis of Variance
Exam 1: An Introduction to Business Statistics and Analytics98 Questions
Exam 2: Descriptive Statistics and Analytics: Tabular and Graphical Methods120 Questions
Exam 3: Descriptive Statistics and Analytics: Numerical Methods145 Questions
Exam 4: Probability and Probability Models150 Questions
Exam 5: Predictive Analytics I: Trees, K-Nearest Neighbors, Naive Bayes,101 Questions
Exam 6: Discrete Random Variables150 Questions
Exam 7: Continuous Random Variables150 Questions
Exam 8: Sampling Distributions111 Questions
Exam 9: Confidence Intervals149 Questions
Exam 10: Hypothesis Testing150 Questions
Exam 11: Statistical Inferences Based on Two Samples140 Questions
Exam 12: Experimental Design and Analysis of Variance132 Questions
Exam 13: Chi-Square Tests120 Questions
Exam 14: Simple Linear Regression Analysis147 Questions
Exam 15: Multiple Regression and Model Building85 Questions
Exam 16: Predictive Analytics Ii: Logistic Regression, Discriminate Analysis,101 Questions
Exam 17: Time Series Forecasting and Index Numbers161 Questions
Exam 18: Nonparametric Methods103 Questions
Exam 19: Decision Theory90 Questions
Select questions type
Consider the following partial analysis of variance table from a randomized block design with 6 blocks and 4 treatments.
 Determine the degrees of freedom for error.
Free
(Short Answer)
4.7/5  (38)
(38)
Correct Answer: Verified
df error = 15
(4 − 1)(6 − 1) = 15
ANOVA table
 Post hoc analysis
Tukey simultaneous comparison t-values
Post hoc analysis
Tukey simultaneous comparison t-values
 The Excel/MegaStat output given above summarizes the results of a one-way analysis of variance in an attempt to compare the performance characteristics of four brands of vacuum cleaners. The response variable is the amount of time it takes to clean a specific size room with a specific amount of dirt.
Use the information above and determine a Tukey simultaneous 95 percent confidence interval for μ1 − μ2. The mean and sample sizes for brand 1 and brand 2 are as follows:
The Excel/MegaStat output given above summarizes the results of a one-way analysis of variance in an attempt to compare the performance characteristics of four brands of vacuum cleaners. The response variable is the amount of time it takes to clean a specific size room with a specific amount of dirt.
Use the information above and determine a Tukey simultaneous 95 percent confidence interval for μ1 − μ2. The mean and sample sizes for brand 1 and brand 2 are as follows:  = 2.95,
  = 2.28, n1 = 4, and n2 = 5.
Free
(Short Answer)
5.0/5 (37)
Correct Answer:Verified
[.035, 1.305]
[(2.95 − 2.28) ± (4.11/ ![[.035, 1.305] [(2.95 − 2.28) ± (4.11/ )( )] = [.67 ± (2.9066)(.2185)] = [.67 ± .635] = [.035, 1.305]](https://storage.examlex.com/TB7056/11ead627_0a58_9ebf_93a1_b53eb33e8df3_TB7056_11.jpg) )(
)( ![[.035, 1.305] [(2.95 − 2.28) ± (4.11/ )( )] = [.67 ± (2.9066)(.2185)] = [.67 ± .635] = [.035, 1.305]](https://storage.examlex.com/TB7056/11ead627_0a58_c5d0_93a1_590df1bacf1f_TB7056_11.jpg) )] = [.67 ± (2.9066)(.2185)] = [.67 ± .635] = [.035, 1.305]
)] = [.67 ± (2.9066)(.2185)] = [.67 ± .635] = [.035, 1.305]
Consider the following partial analysis of variance table from a randomized block design with 10 blocks and 6 treatments.
 Test H0: there is no difference between treatment effects at α = .05.
Free
(Short Answer)
4.9/5 (38)
Correct Answer:Verified
Since our calculated F value (1.91) is less than the critical F value (2.422) we cannot reject the null hypothesis; there is no evidence of difference between treatments.  =
=  = 1.91
F = 1.91
F.05,5,45 = 2.422
1.91 < 2.422, so do not reject the null hypothesis.
In one-way ANOVA, the numerator degrees of freedom equals the number of samples being compared.
(True/False)
4.8/5 (28)
Consider the following partial analysis of variance table from a randomized block design with 10 blocks and 6 treatments.
 What is the calculated F statistic for treatment?
(Short Answer)
4.8/5 (39)
In a one-way analysis of variance with three treatments, each with five measurements, in which a completely randomized design is used, what are the degrees of freedom for error?
(Short Answer)
4.9/5 (31)
________ refers to applying a treatment to more than one experimental unit.
(Multiple Choice)
4.8/5 (35)
A company that fills one-gallon containers of water has four machines. The quality control manager needs to determine whether the average fill for these machines is the same. For a sample of 19 one-gallon containers, we have the following data of fill measures (x) in quarts.
Machine 1 Machine 2 Machine 3 Machine 4
N 4 6 5 4
(3 - 2) ± 4.53  = (-2.377, 4.377) 4.03 4.0017 3.974 4.005
S 0.0183 0.0117 0.0182 0.0129
And the following partial ANOVA table.
= (-2.377, 4.377) 4.03 4.0017 3.974 4.005
S 0.0183 0.0117 0.0182 0.0129
And the following partial ANOVA table.
 Determine the degrees of freedom for the treatment, error, and total, and state the critical value of the F statistic at α = .05.
(Short Answer)
4.8/5 (36)
In a completely randomized ANOVA, with other things equal, as the sample means get closer to each other, the probability of rejecting the null hypothesis
(Multiple Choice)
4.9/5 (37)
When we compute 100(1 − α) confidence intervals, the value of α is called the
(Multiple Choice)
4.8/5 (36)
ANOVA table  Post hoc analysis
Tukey simultaneous comparison t-values
Post hoc analysis
Tukey simultaneous comparison t-values
 The Excel/MegaStat output given above summarizes the results of a one-way analysis of variance in an attempt to compare the performance characteristics of four brands of vacuum cleaners. The response variable is the amount of time it takes to clean a specific size room with a specific amount of dirt.
At a significance level of .05, the null hypothesis for the ANOVA F test is rejected. Analysis of the Tukey simultaneous confidence intervals shows that at the significance level (experimentwise) of .05, we would conclude that
The Excel/MegaStat output given above summarizes the results of a one-way analysis of variance in an attempt to compare the performance characteristics of four brands of vacuum cleaners. The response variable is the amount of time it takes to clean a specific size room with a specific amount of dirt.
At a significance level of .05, the null hypothesis for the ANOVA F test is rejected. Analysis of the Tukey simultaneous confidence intervals shows that at the significance level (experimentwise) of .05, we would conclude that
(Multiple Choice)
4.9/5 (31)
Consider the following partial analysis of variance table from a randomized block design with 6 blocks and 4 treatments.
 What is the treatment mean square?
(Short Answer)
4.7/5 (36)
The ________ units are the entities (objects, people, etc.) to which the treatments are assigned.
(Multiple Choice)
4.8/5 (31)
 Consider the randomized block design with 4 blocks and 3 treatments given above. What is the value of the F statistic for blocks?
(Short Answer)
4.9/5 (35)
Consider the following partial analysis of variance table from a randomized block design with 10 blocks and 6 treatments.
 What is the treatment mean square?
(Short Answer)
4.7/5 (29)
Looking at four different diets, a researcher randomly assigned 20 equally overweight individuals into each of the four diets. What are the degrees of freedom for the individual confidence intervals?
(Short Answer)
4.8/5 (35)
Find a Tukey simultaneous 95 percent confidence interval for μ1 − μ2, where  = 33.98,
  = 36.56, and MSE = .669. There were 15 observations total and 3 treatments. Assume that the number of observations in each treatment is equal.
(Short Answer)
4.9/5 (25)
In one-way ANOVA, the total sum of squares is equal to ________.
(Multiple Choice)
4.7/5 (35)
When computing individual confidence intervals using the t statistic, for all possible pairwise comparisons of means, the experimentwise error rate will be
(Multiple Choice)
4.9/5 (35)
A vitamin-water manufacturer wants to compare the effects on sales of three water colors: green, blue, and red. Four regions are selected for the test, with the following ANOVA results.
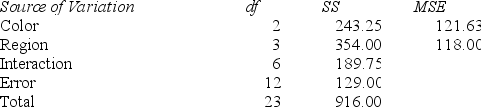 Compute the mean square and F to test the null hypothesis that there is no interaction at α = .01.
(Short Answer)
4.8/5 (39)
Filters
- Essay(0)
- Multiple Choice(0)
- Short Answer(0)
- True False(0)
- Matching(0)