Exam 14: Simple Linear Regression Analysis
Exam 1: An Introduction to Business Statistics and Analytics98 Questions
Exam 2: Descriptive Statistics and Analytics: Tabular and Graphical Methods120 Questions
Exam 3: Descriptive Statistics and Analytics: Numerical Methods145 Questions
Exam 4: Probability and Probability Models150 Questions
Exam 5: Predictive Analytics I: Trees, K-Nearest Neighbors, Naive Bayes,101 Questions
Exam 6: Discrete Random Variables150 Questions
Exam 7: Continuous Random Variables150 Questions
Exam 8: Sampling Distributions111 Questions
Exam 9: Confidence Intervals149 Questions
Exam 10: Hypothesis Testing150 Questions
Exam 11: Statistical Inferences Based on Two Samples140 Questions
Exam 12: Experimental Design and Analysis of Variance132 Questions
Exam 13: Chi-Square Tests120 Questions
Exam 14: Simple Linear Regression Analysis147 Questions
Exam 15: Multiple Regression and Model Building85 Questions
Exam 16: Predictive Analytics Ii: Logistic Regression, Discriminate Analysis,101 Questions
Exam 17: Time Series Forecasting and Index Numbers161 Questions
Exam 18: Nonparametric Methods103 Questions
Exam 19: Decision Theory90 Questions
Select questions type
In simple regression analysis, the quantity Σ(Ŷ − Ȳ)2 is called the ________ sum of squares.
Free
(Multiple Choice)
5.0/5  (37)
(37)
Correct Answer: Verified
B
In simple regression analysis, the quantity that gives the amount by which Y (dependent variable) changes for a unit change in X (independent variable) is called the
Free
(Multiple Choice)
4.8/5 (43)
Correct Answer:Verified
B
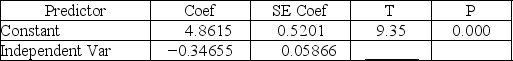
Consider the following partial computer output from a simple linear regression analysis.
 S = .4862R-Sq = ________
Analysis of Variance
S = .4862R-Sq = ________
Analysis of Variance
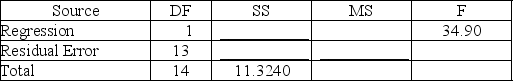 Test H0: β1 = 0 versus Ha: β1 ≠ 0 by setting α = .001. What do you conclude about the relationship between y and x?
Free
(Short Answer)
4.8/5 (40)
Correct Answer:Verified
Since our calculated t - value is −5.908 which is less than the critical value of −4.221 we reject the null hypothesis and conclude there is a significant linear relationship between x and y.
−.34655/.05866 = −5.908, compared to t statistic of −4.221 (for α = .001, df = 13). Thus, reject the null hypothesis at .001. There is a significant linear relationship between x and y.
A local tire dealer wants to predict the number of tires sold each month. He believes that the number of tires sold is a linear function of the amount of money invested in advertising. He randomly selects 6 months of data consisting of tire sales (in thousands of tires) and advertising expenditures (in thousands of dollars). Based on the data set with 6 observations, the simple linear regression model yielded the following results.
∑X = 24
∑X2 = 124
∑Y = 42
∑Y2 = 338
∑XY = 196
Determine the value of the F statistic.
(Short Answer)
4.9/5 (39)
A data set with 7 observations yielded the following. Use the simple linear regression model.
∑X = 21.57
∑X2 = 68.31
∑Y = 188.9
∑Y2 = 5,140.23
∑XY = 590.83
SSE = 1.117
Calculate the correlation coefficient.
(Short Answer)
4.9/5 (35)
An experiment was performed on a certain metal to determine if the strength is a function of heating time. Results based on 10 metal sheets are given below. Use the simple linear regression model.
∑X = 30
∑X2 = 104
∑Y = 40
∑Y2 = 178
∑XY = 134
Determine the value of the F statistic.
(Short Answer)
4.8/5 (29)
In a simple linear regression model, the intercept term is the mean value of y when x equals ________.
(Multiple Choice)
4.8/5 (39)
Consider the following partial computer output from a simple linear regression analysis.

 Analysis of Variance
 Calculate the MSE.
(Short Answer)
4.8/5 (33)
Consider the following partial computer output from a simple linear regression analysis.
 S = .4862R-Sq = ________
Analysis of Variance
S = .4862R-Sq = ________
Analysis of Variance
 Test to determine if there is a significant correlation between x and y. Use H0: ρ = 0 versus Ha: ρ ≠ 0 with α = .01. Show the test statistic used in the decision.
(Short Answer)
4.9/5 (30)
A data set with 7 observations yielded the following. Use the simple linear regression model.
∑X = 21.57
∑X2 = 68.31
∑Y = 188.9
∑Y2 = 5,140.23
∑XY = 590.83
SSE = 1.117
Find the estimated slope.
(Short Answer)
4.8/5 (33)
If r = −1, then we can conclude that there is a perfect relationship between X and Y.
(True/False)
4.9/5 (43)
A local tire dealer wants to predict the number of tires sold each month. He believes that the number of tires sold is a linear function of the amount of money invested in advertising. He randomly selects 6 months of data consisting of tire sales (in thousands of tires) and advertising expenditures (in thousands of dollars). Based on the data set with 6 observations, the simple linear regression model yielded the following results.
∑X = 24
∑X2 = 124
∑Y = 42
∑Y2 = 338
∑XY = 196
Determine the values of SSE and SST.
(Short Answer)
4.8/5 (34)
An experiment was performed on a certain metal to determine if the strength is a function of heating time. You use a sample size of 10 to test this hypothesis. The simple linear regression equation is ŷ = 1 + 1X, and the sample coefficient of determination (r2) = .7777. The time is in minutes and the strength is measured in pounds per square inch. Test to determine if there is a significant correlation between the heating time and strength of the metal. Using H0: ρ = 0 vs. HA: ρ ≠ 0 at α = .05, determine the test statistic and decision.
(Short Answer)
4.8/5 (34)
A local tire dealer wants to predict the number of tires sold each month. He believes that the number of tires sold is a linear function of the amount of money invested in advertising. He randomly selects 6 months of data consisting of tire sales (in thousands of tires) and advertising expenditures (in thousands of dollars). Based on the data set with 6 observations, the simple linear regression equation of the least squares line is ŷ = 3 + 1x.
∑X = 24
∑X2 = 124
∑Y = 42
∑Y2 = 338
∑XY = 196
MSE = 4
Use the least squares regression equation and estimate the monthly tire sales when advertising expenditures = $4,000.
(Short Answer)
4.8/5 (38)
The following results were obtained from a simple regression analysis.
Ŷ = 37.2895 − (1.2024)X
r2 = .6744sb = .2934
What is the proportion of the variation explained by the simple linear regression model?
(Short Answer)
4.8/5 (35)
A local tire dealer wants to predict the number of tires sold each month. He believes that the number of tires sold is a linear function of the amount of money invested in advertising. He randomly selects 6 months of data consisting of tire sales (in thousands of tires) and advertising expenditures (in thousands of dollars). Based on the data set with 6 observations, the simple linear regression model yielded the following results.
∑X = 24
∑X2 = 124
∑Y = 42
∑Y2 = 338
∑XY = 196
Find the rejection point for the t statistic at α = .05 and test H0: β1 ≤ 0 vs. Hα: β1 > 0.
(Short Answer)
4.8/5 (43)
Which of the following is a violation of the independence assumption?
(Multiple Choice)
4.9/5 (29)
A local tire dealer wants to predict the number of tires sold each month. He believes that the number of tires sold is a linear function of the amount of money invested in advertising. He randomly selects 6 months of data consisting of tire sales (in thousands of tires) and advertising expenditures (in thousands of dollars). Based on the data set with 6 observations, the simple linear regression model yielded the following results.
∑X = 24
∑X2 = 124
∑Y = 42
∑Y2 = 338
∑XY = 196
Calculate the sample correlation coefficient.
(Short Answer)
4.9/5 (37)
In simple regression analysis, the standard error is ________ greater than the standard deviation of y values.
(Multiple Choice)
4.8/5 (30)
The residual is the difference between the observed value of the dependent variable and the predicted value of the dependent variable.
(True/False)
4.7/5 (48)
Filters
- Essay(0)
- Multiple Choice(0)
- Short Answer(0)
- True False(0)
- Matching(0)