Exam 2: Visualizing Data With Charts and Graphs
Exam 1: Introduction to Statistics and Business Analytics180 Questions
Exam 2: Visualizing Data With Charts and Graphs113 Questions
Exam 3: Descriptive Statistics88 Questions
Exam 4: Probability104 Questions
Exam 5: Discrete Distributions98 Questions
Exam 6: Continuous Distributions105 Questions
Exam 7: Sampling and Sampling Distributions97 Questions
Exam 8: Statistical Inference: Estimation for Single Populations94 Questions
Exam 9: Statistical Inference: Hypothesis Testing for Single Populations123 Questions
Exam 10: Statistical Inferences About Two Populations97 Questions
Exam 11: Analysis of Variance and Design of Experiments133 Questions
Exam 12: Simple Regression Analysis and Correlation111 Questions
Exam 13: Multiple Regression Analysis90 Questions
Exam 14: Building Multiple Regression Models100 Questions
Exam 15: Time-Series Forecasting and Index Numbers103 Questions
Exam 16: Analysis of Categorical Data85 Questions
Exam 17: Nonparametric Statistics110 Questions
Exam 18: Statistical Quality Control99 Questions
Exam 19: Decision Analysis109 Questions
Select questions type
The staff of Mr.Wayne Wertz, VP of Operations at Portland Peoples Bank, prepared a cumulative frequency ogive of waiting time for walk-in customers. 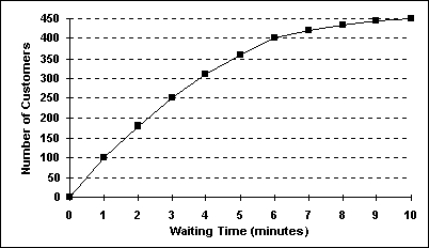 The percentage of walk-in customers waiting one minute or less was _________.
(Multiple Choice)
4.8/5  (33)
(33)
The following class intervals for a frequency distribution were developed to provide information regarding the starting salaries for students graduating from a particular school: Salary ( \1 ,000s) Number of Graduates 28-under 31 - 31-under 35 - 34-under 37 - 39-under 40 -
Before data were collected, someone questioned the validity of this arrangement.Which of the following represents a problem with this set of intervals?
(Multiple Choice)
4.9/5 (37)
In a frequency distribution, the first class interval begins at 18.The midpoint of the first class interval is 19.5, and the last class interval ends at 51.How many class intervals are there?
(Multiple Choice)
4.8/5 (34)
A retail shoe company would like to consider key elements that might impact the sales related a specific store's location in the town.If placed on a scatter plot, which two variables would be helpful in helping management with this information?
(Multiple Choice)
4.8/5 (34)
Consider the following frequency distribution: Class Interval Frequency 10 -under 20 15 20 -under 30 25 30 -under 40 10
What is the relative frequency of the first class?
(Multiple Choice)
4.9/5 (35)
The staff of Mr.Wayne Wertz, VP of Operations at Portland Peoples Bank, prepared a frequency histogram of waiting time for drive up ATM customers. 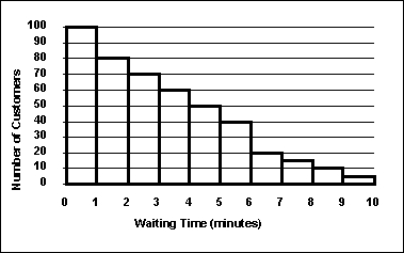 Approximately _____ drive up ATM customers waited less than 2 minutes.
(Multiple Choice)
4.8/5 (31)
The following is a bar chart of the self-reported race for 189 pregnant women. 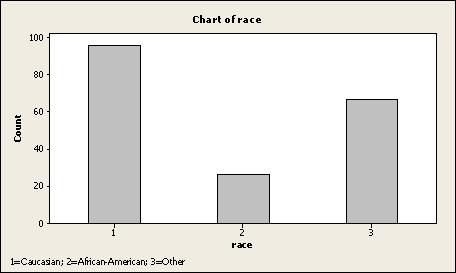 Approximately _____ percent of pregnant women are African-American
(Multiple Choice)
4.9/5 (37)
Sales are tracked during the past year in the graph below. 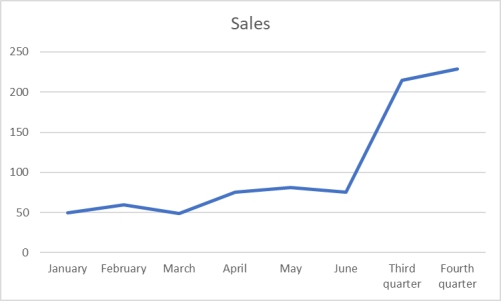 Management is pleased to show the growth in sales at the end of the year.Why would this be an incorrect conclusion?
(Multiple Choice)
4.9/5 (39)
The 2010 and 2012 market share data of three competitors (Alston, Baren, and Clemson)in an oligopolistic industry are presented in the following pie charts. 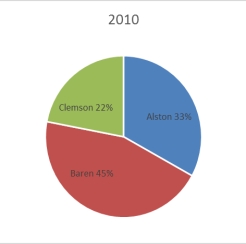
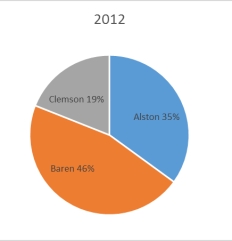 Which of the following is true?
(Multiple Choice)
4.8/5 (30)
An instructor has decided to graphically represent the grades on a test.The instructor uses a plus/minus grading system (i.e.she gives grades of A-, B+, etc.).Which of the following would provide the most information for the students?
(Multiple Choice)
4.9/5 (26)
Each day, the manager at Jamie's Auto Care Shop prepares a frequency distribution and a histogram of sales transactions by dollar value of the transactions.Friday's histogram follows. 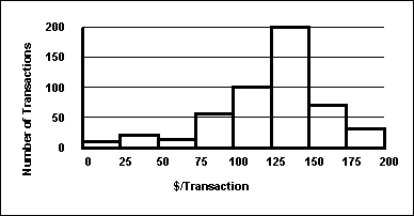 On Friday, the approximate number of sales transactions between $150 and $175 was _____________.
(Multiple Choice)
4.8/5 (31)
Visualization of time-series data is considered descriptive business analytics.
(True/False)
4.8/5 (35)
In a frequency distribution, the first class interval begins at 18.The midpoint of the first class interval is 19.5, and the midpoint of the last class interval is 49.5.How many class intervals are there?
(Multiple Choice)
4.8/5 (35)
The staff of Mr.Wayne Wertz, VP of Operations at Portland Peoples Bank, prepared a cumulative frequency ogive of waiting time for walk-in customers.  The percentage of walk-in customers waiting more than 6 minutes was ______.
(Multiple Choice)
4.8/5 (42)
In a histogram, the tallest bar(s)represents the class or classes with the highest cumulative frequency.
(True/False)
4.7/5 (43)
An instructor made a frequency table of the scores his students got on a test
Score Frequency 30 -under 40 1 40 -under 50 4 50 -under 60 5 60 -under 70 10 70 -under 80 20 80 -under 90 10 90 -under 100 5
The midpoint of the last class interval is _________.
(Multiple Choice)
4.9/5 (36)
Each day, the office staff at Oasis Quick Shop prepares a frequency distribution and an ogive of sales transactions by dollar value of the transactions.Saturday's cumulative frequency ogive follows. 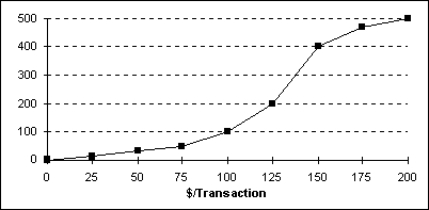 The percentage of sales transactions on Saturday that were between $100 and $150 was _____________.
(Multiple Choice)
4.7/5 (30)
A Pareto chart and a pie chart are both types of qualitative graphs.
(True/False)
4.7/5 (32)
Filters
- Essay(0)
- Multiple Choice(0)
- Short Answer(0)
- True False(0)
- Matching(0)