Exam 2: Visualizing Data With Charts and Graphs
Exam 1: Introduction to Statistics and Business Analytics180 Questions
Exam 2: Visualizing Data With Charts and Graphs113 Questions
Exam 3: Descriptive Statistics88 Questions
Exam 4: Probability104 Questions
Exam 5: Discrete Distributions98 Questions
Exam 6: Continuous Distributions105 Questions
Exam 7: Sampling and Sampling Distributions97 Questions
Exam 8: Statistical Inference: Estimation for Single Populations94 Questions
Exam 9: Statistical Inference: Hypothesis Testing for Single Populations123 Questions
Exam 10: Statistical Inferences About Two Populations97 Questions
Exam 11: Analysis of Variance and Design of Experiments133 Questions
Exam 12: Simple Regression Analysis and Correlation111 Questions
Exam 13: Multiple Regression Analysis90 Questions
Exam 14: Building Multiple Regression Models100 Questions
Exam 15: Time-Series Forecasting and Index Numbers103 Questions
Exam 16: Analysis of Categorical Data85 Questions
Exam 17: Nonparametric Statistics110 Questions
Exam 18: Statistical Quality Control99 Questions
Exam 19: Decision Analysis109 Questions
Select questions type
The staff of Ms.Tamara Hill, VP of Technical Analysis at Blue Sky Brokerage, prepared a frequency histogram of market capitalization of the 937 corporations listed on the American Stock Exchange in January 2019. Enlarged chart below and same chart in question 65 is also made larger, per suggestion 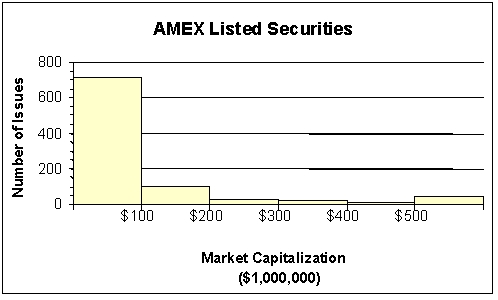 Approximately ________ corporations had capitalization exceeding $200,000,000.
(Multiple Choice)
4.8/5  (29)
(29)
A shirt production company has tracked their production since the company started in 1999.The graph of their annual production is shown. 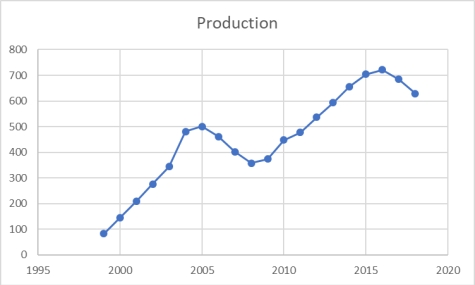 After 2005, in what year did production recover and surpass the production level of 2005?
(Multiple Choice)
4.8/5 (40)
Each day, the manager at Jamie's Auto Care Shop prepares a frequency distribution and a histogram of sales transactions by dollar value of the transactions.Friday's histogram follows. 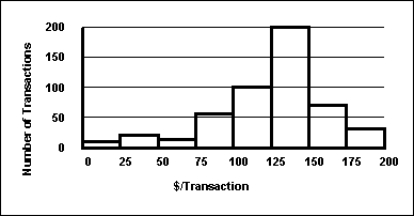 On Friday, the approximate number of sales transactions in the 75-under 100 category was _____________.
(Multiple Choice)
4.9/5 (35)
For any given data set, a frequency distribution with a larger number of classes will always be better than the one with a smaller number of classes.
(True/False)
4.8/5 (44)
The following class intervals for a frequency distribution were developed to provide information regarding the starting salaries for students graduating from a particular school: Salary ( \1 ,000s) 28 -under 31 31-under 35 34 -under 37 39-under 40 Number of Graduates - - - -
Before data were collected, someone questioned the validity of this arrangement.Which of the following represents a problem with this set of intervals?
(Multiple Choice)
4.9/5 (38)
Scott Brim, Chief Financial Officer of Space Mall, Inc., wants to better understand the busiest business hours during the weekend.There are door sensors that approximate the number of people who enter the mall.The table below presents the average number of people coming in during the weekend, for the last month each hour: Hour Number of People 9-under 10 350 10-under 11 400 11-under 12 300 12-under 1 650 1-under 2 550 2-under 3 400 3-under 4 350 4-under 5 450 5-under 6 250 6-under 7 300 7-under 8 200 8-under 9 300
The relative frequency of the fourth class interval is _________.
(Multiple Choice)
4.8/5 (35)
Consider the following frequency distribution: Class Interval Frequency 100 -under 200 25 200 -under 300 45 300 -under 400 30
What is the midpoint of the last class interval?
(Multiple Choice)
4.8/5 (33)
A graphical representation of a frequency distribution is called a pie chart.
(True/False)
4.7/5 (36)
The staff of Mr.Wayne Wertz, VP of Operations at Portland Peoples Bank, prepared a frequency histogram of waiting time for drive up ATM customers. 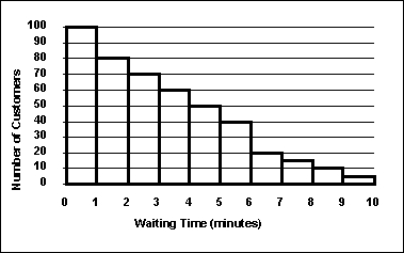 Approximately ____ drive up ATM customers waited at least 7 minutes.
(Multiple Choice)
4.8/5 (36)
Consider the relative frequency distribution given Class Interval Relative Frequency 20-under 40 0.2 40 -under 60 0.3 60 -under 80 0.4 80-under 100 0.1
There were 60 numbers in the data set.How many numbers were in the interval 20-under 40?
(Multiple Choice)
4.9/5 (41)
The staff of the accounting and the quality control departments rated their respective supervisor's leadership style as either (1)authoritarian or (2)participatory.Sixty-eight percent of the accounting staff rated their supervisor "authoritarian," and thirty-two percent rated him/her "participatory." Forty percent of the quality control staff rated their supervisor "authoritarian," and sixty percent rated him/her "participatory." The best graphic depiction of these data would be two ___________________.
(Multiple Choice)
4.7/5 (32)
A shirt production company has tracked their sales of red and blue shirts over the past few years.The graph of both is shown below. 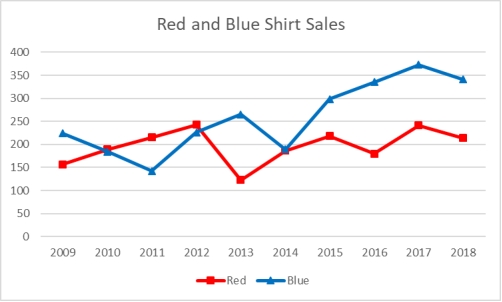 Which of the following is a true statement about the trends in sales?
(Multiple Choice)
4.8/5 (35)
Consider a scatterplot showing the relationship between years of formal education and life expectancy.Which of the following statements is false?
(Multiple Choice)
4.8/5 (31)
Filters
- Essay(0)
- Multiple Choice(0)
- Short Answer(0)
- True False(0)
- Matching(0)