Exam 6: The Ways of Change: Drift and Selection
Exam 1: The Whale and the Virus: How Scientists Study Evolution37 Questions
Exam 2: From Natural Philosophy to Darwin: a Brief History of Evolutionary Ideas42 Questions
Exam 3: What the Rocks Say: How Geology and Paleontology Reveal the History of Life84 Questions
Exam 4: The Tree of Life: How Biologists Use Phylogeny to Reconstruct the Deep Past42 Questions
Exam 5: Raw Material: Heritable Variation Among Individuals51 Questions
Exam 6: The Ways of Change: Drift and Selection71 Questions
Exam 7: Beyond Alleles: Quantitative Genetics and the Evolution of Phenotypes42 Questions
Exam 8: The History in Our Genes65 Questions
Exam 9: From Genes to Traits: the Evolution of Genetic Networks and Development67 Questions
Exam 10: Natural Selection: Empirical Studies in the Wild40 Questions
Exam 11: Sex: Causes and Consequences43 Questions
Exam 12: After Conception: the Evolution of Life History and Parental Care43 Questions
Exam 13: The Origin of Species48 Questions
Exam 14: Macroevolution: the Long Run57 Questions
Exam 15: Intimate Partnerships: How Species Adapt to Each Other39 Questions
Exam 16: Brains and Behavior60 Questions
Exam 17: Human Evolution: a New Kind of Ape70 Questions
Exam 18: Evolutionary Medicine70 Questions
Select questions type
Contrast evolution by natural selection with evolution by genetic drift.
(Short Answer)
4.9/5  (30)
(30)
Why was Charles II of Spain, of the Hapsburg dynasty, called el hechizado, the "hexed"?
(Multiple Choice)
4.8/5 (40)
How do gene frequencies behave in Hardy-Weinberg equilibrium?
(Multiple Choice)
4.9/5 (39)
Why might an endangered species, whose population numbers are already low, be even more threatened to extinction because of inbreeding?
(Short Answer)
4.8/5 (29)
Earth's biotic and abiotic environments are changing rapidly due, in part, to human activities. For example, the introduction of non-native invasive species into new habitats and climate change highlight two ways in which humans are altering the environment experienced by other species. Some species will probably adapt to these changes, while others may not. Considering the processes of mutation, natural selection, and genetic drift, comment on the likelihood of adaptation to environmental change for species that have small population sizes versus species with large population sizes. At a minimum, a fully correct answer will incorporate all three of these processes into the answer.
(Essay)
4.7/5 (43)
Which of the following statements is/are supported by the figure? 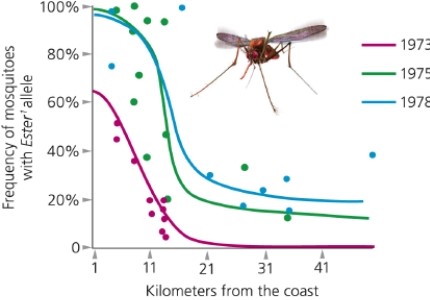
(Multiple Choice)
4.8/5 (39)
The graph below shows results of two simulations, both depicting the rise in frequency of a beneficial allele in a population of infinite size. The selection coefficient and the starting frequency are the same, but in one simulation the beneficial allele is dominant and in the other it is recessive. Neither allele is fixed by 500 generations. 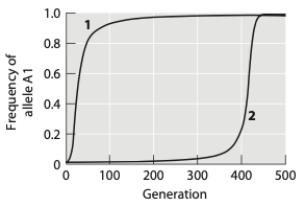 (a) Which simulation shows results for a dominant and which shows results for a recessive allele? How can you tell?
(b) Neither of the alleles reaches fixation by 500 generations. If given enough time, will both of these alleles reach fixation in the population? Why or why not?
(a) Which simulation shows results for a dominant and which shows results for a recessive allele? How can you tell?
(b) Neither of the alleles reaches fixation by 500 generations. If given enough time, will both of these alleles reach fixation in the population? Why or why not?
(Not Answered)
This question doesn't have any answer yet
Lively and Dybdahl studied parasite infection rates in a population of asexual clonal snails. The graph below shows relative infection rates for the four most common clone genotypes and for several rare genotypes (all lumped together). Based on these data, they hypothesized that parasites adapted to infecting the most common clone genotypes in the population, and thus these genotypes had lower fitness. This is consistent with ________ operating in the population. Further evidence would be provided if ________. 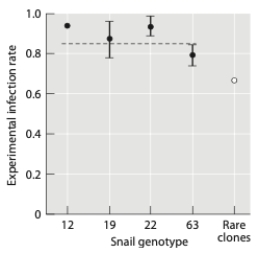
(Multiple Choice)
4.9/5 (37)
Some Drosophila melanogaster larvae use a "sitting" foraging strategy in which they feed more or less in the same location, while "rovers" wander around the substrate looking for more food sources. In the graph below, the dotted line corresponds to sitters and the solid line corresponds to rovers. This is an example of _______; over time we expect ________. 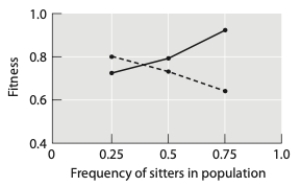
(Multiple Choice)
4.8/5 (33)
Filters
- Essay(0)
- Multiple Choice(0)
- Short Answer(0)
- True False(0)
- Matching(0)