Exam 13: Project Evaluation and Control
Exam 1: Introduction: Why Project Management103 Questions
Exam 2: The Organizational Context: Strategy, Structure, and Culture103 Questions
Exam 3: Project Selection and Portfolio Management99 Questions
Exam 4: Leadership and the Project Manager101 Questions
Exam 5: Scope Management103 Questions
Exam 6: Project Team Building, Conflict, and Negotiation102 Questions
Exam 7: Risk Management98 Questions
Exam 8: Cost Estimation and Budgeting102 Questions
Exam 9: Project Scheduling: Networks, Duration Estimation, and Critical Path105 Questions
Exam 10: Project Scheduling: Lagging, Crashing, and Activity Networks96 Questions
Exam 11: Advanced Topics in Planning and Scheduling: Agile and Critical Chain101 Questions
Exam 12: Resource Management99 Questions
Exam 13: Project Evaluation and Control104 Questions
Exam 14: Project Closeout and Termination101 Questions
Select questions type
Identify a different key success driver and inhibitor for the project stages of formation, build-up, main phase, and close-out.
Free
(Essay)
4.8/5  (30)
(30)
Correct Answer: Verified
There is considerable overlap in many of the key success drivers and inhibitors for project success. The presence of team and personal motivation and top management support appear throughout all of the phases of successful projects. Poor leadership and an unmotivated team are equally popular in each phase of a failed project. The breakdown in its entirety appears in the table. 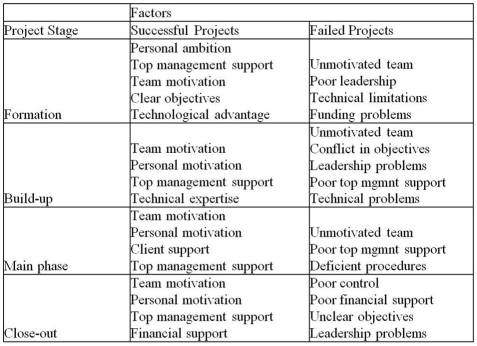
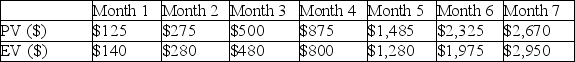
Use this earned schedule table to determine the earned schedule for this project at the end of Month 6. 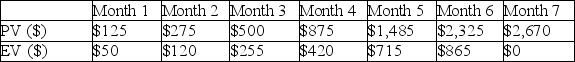
Free
(Multiple Choice)
4.8/5 (33)
Correct Answer:Verified
D
Knowing the correct steps to take once problems develop is a function of a team's:
Free
(Multiple Choice)
4.8/5 (45)
Correct Answer:Verified
B
Use the S-curves for this project to create a table showing budgeted and actual expenses and variance in thousands of dollars and comment on the project's performance. The horizontal axis is in weeks. 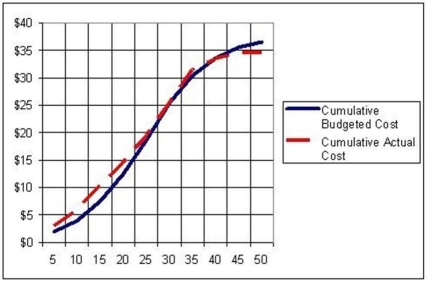
(Essay)
4.7/5 (46)
Each activity contained a series of milestones that represented a previously agreed-upon amount of work. Once the low graffiti was erased, 35% of the activity had been completed and once the mid-level graffiti was erased, 70% of the activity had been completed. This project manager was clearly in the:
(Multiple Choice)
4.8/5 (35)
A recurring problem with establishing accurate or meaningful EVM results has to do with:
(Multiple Choice)
4.8/5 (40)
The project implementation profile assesses the performance of the project team with respect to 10 critical success factors and can be used on an ongoing project.
(True/False)
4.8/5 (36)
Use the data to calculate the schedule performance index for the project for the end of week 20. All amounts are in thousands of dollars. 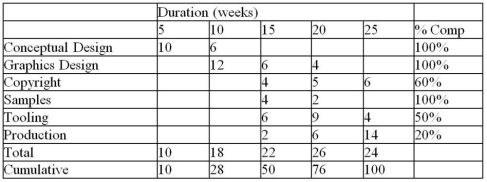
(Multiple Choice)
4.8/5 (34)
The earned value of a project is the cumulative total costs incurred in accomplishing the various work packages.
(True/False)
4.8/5 (30)
A measurement process that determines the project goals and then the degree to which the actual performance lives up to these goals is:
(Multiple Choice)
4.7/5 (44)
Use the S-curve where the solid line is actual cost and the dashed line is budgeted cost to choose the BEST statement. 
(Multiple Choice)
4.8/5 (37)
Inspired by his trip to Greece, the gentleman farmer decided he needed a Mykonos-style windmill pumping a pond for his sheep and orchard. His earned value table for the project appears below. At the end of June, what was the estimated time to completion and the estimated cumulative cost to completion?
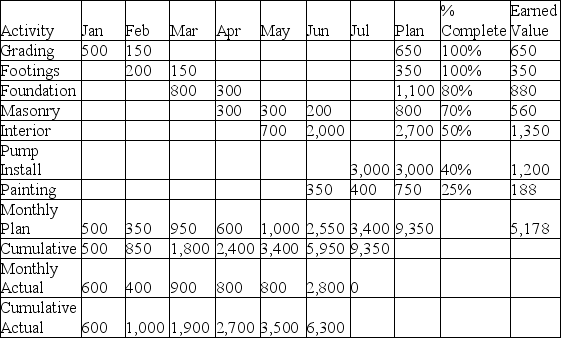
(Essay)
4.8/5 (38)
Use this earned schedule table to determine the schedule performance index (t) for this project at the end of Month 6. 
(Multiple Choice)
4.8/5 (34)
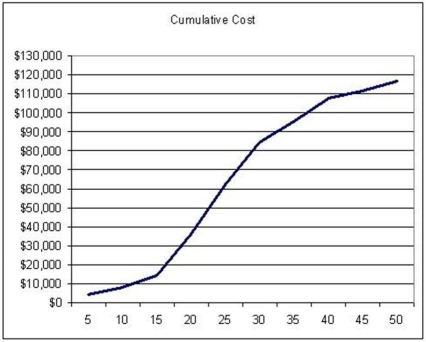 -Use the S-curve to choose the BEST statement about the project it describes. The horizontal axis is in weeks.
(Multiple Choice)
4.9/5 (38)
Use the S-curve where the solid line is actual cost and the dashed line is budgeted cost to choose the BEST statement. 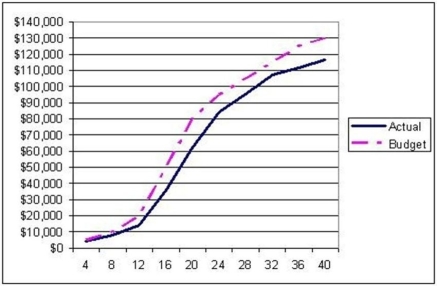
(Multiple Choice)
4.8/5 (31)
At the end of week 10, this project has cost $9,000 and has an earned value as indicated in the table. Use the data to calculate the cost performance index for the project. All amounts are in thousands of dollars. 
(Multiple Choice)
4.8/5 (39)
Use the data to calculate the schedule performance index for the project for the end of week 10. All amounts are in thousands of dollars. 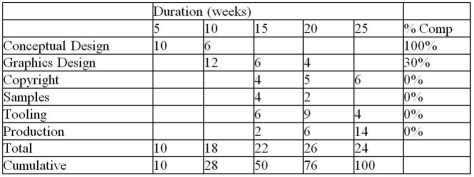
(Multiple Choice)
4.9/5 (33)
Use the information in the table regarding this seven-month project to create two plots. The first plot should be the S-curve for Earned Value. Indicate on this plot whether the project is ahead or behind schedule and by how much. The second plot should be the Earned Schedule and the Estimate at Completion for Time. Comment on the symmetry of this graph and whether you would expect a similar plot from any other project to exhibit similar characteristics.
(Essay)
4.8/5 (32)
Use the data to calculate the earned value for the project. All amounts are in thousands of dollars. 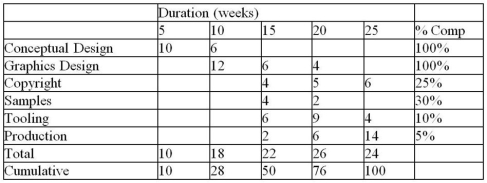
(Multiple Choice)
4.8/5 (40)
Filters
- Essay(0)
- Multiple Choice(0)
- Short Answer(0)
- True False(0)
- Matching(0)