Exam 3: Determining Effective Data Display with Charts
Exam 1: Applying Fundamental Excel Skills and Tools in Problem Solving150 Questions
Exam 2: Solving Problems with Statistical Analysis Tools150 Questions
Exam 3: Determining Effective Data Display with Charts150 Questions
Exam 4: Applying Logic in Decision Making150 Questions
Exam 5: Retrieving Data for Computation, Analysis, and Reference150 Questions
Exam 6: Evaluating the Financial Impact of Loans and Investments150 Questions
Exam 7: Organizing Data for Effective Analysis150 Questions
Exam 8: Using Data Tables and Excel Scenarios for What-If Analysis150 Questions
Exam 9: Enhancing Decision Making with Solver150 Questions
Exam 10: Troubleshooting Workbooks and Automating Excel Applications150 Questions
Select questions type
MATCHING
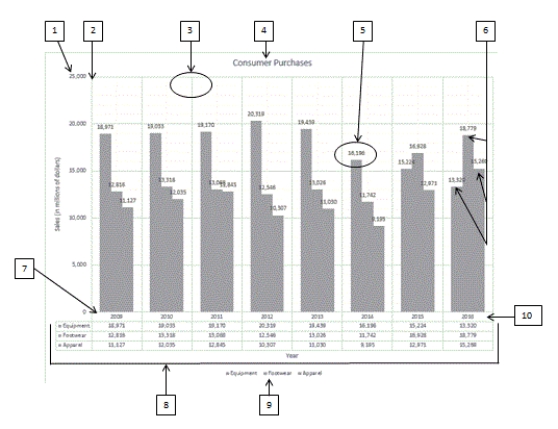 Using the above figure, identify the letter of the choice that best matches the figure.
-#3
Using the above figure, identify the letter of the choice that best matches the figure.
-#3
(Multiple Choice)
4.9/5  (35)
(35)
To modify how gridlines display in a chart's plot area, use the ____________________ options in Chart Elements.
(Short Answer)
4.9/5 (33)
To control the display of individual labels in a chart, use the ____________________ options in Chart Elements.
(Short Answer)
4.7/5 (31)
Charts can successfully organize a large collection of numbers, make comparisons between different parts of the data, and tell a story.
(True/False)
4.8/5 (43)
When a chart is selected, two contextual chart tools appear on the ribbon, and they do NOT include ____.
(Multiple Choice)
4.8/5 (35)
Case-Based Critical Thinking Questions
Case 3-1
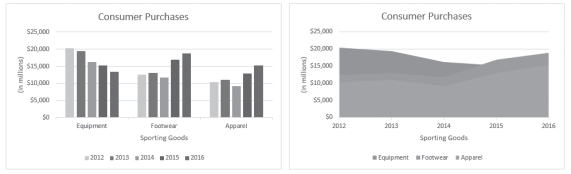 Column Chart Area Chart
Sarah has put together the same information in two different charts, shown in the figure above, to present to her boss. She is thinking through the pros and cons of each chart type.
-Which chart does a better job of illustrating the collective sales trend in the Equipment, Footwear, and Apparel categories over the eight years?
Column Chart Area Chart
Sarah has put together the same information in two different charts, shown in the figure above, to present to her boss. She is thinking through the pros and cons of each chart type.
-Which chart does a better job of illustrating the collective sales trend in the Equipment, Footwear, and Apparel categories over the eight years?
(Multiple Choice)
4.8/5 (29)
Charts can be placed on a separate worksheet that is referred to as a ____.
(Multiple Choice)
4.8/5 (41)
To change the source data, click the Switch Row/Column button in the Data group on the CHART TOOLS ____ tab to open the Select Data Source dialog box.
(Multiple Choice)
5.0/5 (43)
Charts can be embedded as a(n) ____ on the same worksheet as the source data for the chart.
(Multiple Choice)
4.8/5 (40)
Filters
- Essay(0)
- Multiple Choice(0)
- Short Answer(0)
- True False(0)
- Matching(0)