Exam 3: Functions Given by Graphs
Exam 1: Functions Given by Formulas38 Questions
Exam 2: Functions Given by TableChas13 Questions
Exam 3: Functions Given by Graphs38 Questions
Exam 4: Functions Given by Words26 Questions
Exam 5: Table and Trends34 Questions
Exam 6: Graphs37 Questions
Exam 7: Solving Linear Equations35 Questions
Exam 8: Solving Nonlinear Equations38 Questions
Exam 9: Inequalities39 Questions
Exam 10: Optimization36 Questions
Exam 11: The Geometry of Lines46 Questions
Exam 12: Linear Functions39 Questions
Exam 13: Modeling Data with Linear Functions8 Questions
Exam 14: Linear Regression5 Questions
Exam 15: Systems of Equations40 Questions
Exam 16: Exponential Growth and Decay41 Questions
Exam 17: Constant Percentage Change31 Questions
Exam 18: Modeling Exponential Data7 Questions
Exam 19: Modeling Nearly Exponential Data5 Questions
Exam 20: Logarithmic Functions41 Questions
Exam 21: Logistic Functions35 Questions
Exam 22: Power Functions41 Questions
Exam 23: Modeling Data with Power Functions4 Questions
Exam 24: Combining and Decomposing Functions36 Questions
Exam 25: Quadratic Functions24 Questions
Exam 26: Higher Degree Polynomials and Rational Functions27 Questions
Exam 27: Velocity49 Questions
Exam 28: Rates of Change for Other Functions40 Questions
Exam 29 Estimating Rates of Change27 Questions
Exam 30: Equations of Change Linear and Exponential Functions30 Questions
Exam 31: Equations of Change Graphical Solutions39 Questions
Select questions type
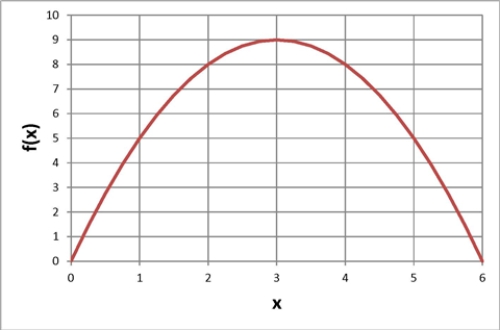
Below is a graph of a function  .What is the value of
  ?
? 
(Multiple Choice)
4.7/5  (32)
(32)
Inflection points may occur where a function is increasing at the fastest rate.
(True/False)
4.8/5 (42)
You put a drink in the freezer to cool.You take it out of the freezer when it is cold.But you forget about the drink and leave it sitting on the kitchen counter.The graph below shows the temperature, in degrees, of the drink t minutes after the drink is placed in the freezer.What is the temperature in the kitchen?
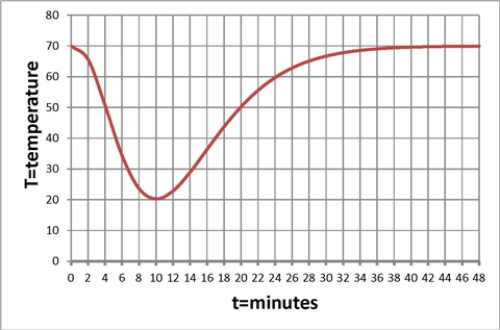
(Multiple Choice)
4.8/5 (29)
Choose the answer that best completes the following sentence.A graph that is increasing and concave up represents a function that is ...
(Multiple Choice)
4.8/5 (34)
The graph below shows the blood-glucose levels, in milligrams per deciliter, as a function of hours since a meal was ingested.The three graphs are for a healthy person (labeled normal), a prediabetic, and a diabetic person.During the period shown on the graph, what is the shortest time since eating that glucose levels are the same for a healthy person and a prediabetic?

(Multiple Choice)
4.8/5 (33)
The graph below shows the fundraising  of the Republican National Committee, in millions of dollars, as a function of the date.The graph indicates that there are two solutions d of the equation
  million.What two dates (approximately) correspond to these solutions?
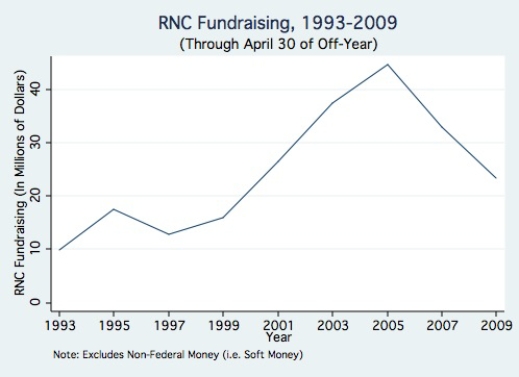
(Multiple Choice)
4.8/5 (37)
Below is a graph of a function  .Find the average rate of change in f from 1 to 3 .
(Multiple Choice)
4.9/5 (36)
Choose the answer that best completes the following sentence.A point of inflection occurs where...
(Multiple Choice)
5.0/5 (34)
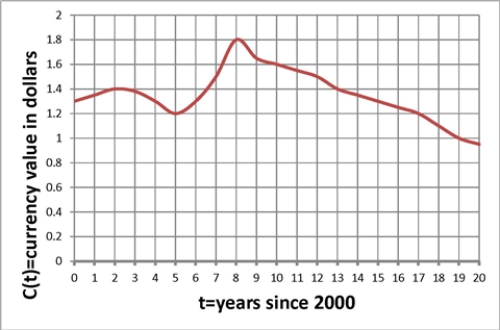
The graph below shows the value, in dollars, of a foreign currency t years after 2000. For what two dates between 2000 and 2020 would earn you the most money if you bought the foreign currency on the first date and sold on the second?
(Multiple Choice)
4.9/5 (39)
The graph below shows the fundraising of the Republican National Committee, in millions of dollars, as a function of the date.During the period shown on the graph when was the minimum amount of funds raised, and what was that amount? 
(Multiple Choice)
4.8/5 (25)
The graph below shows the value, in dollars, of a foreign currency t years after 2000. In what year from 2000 to 2020 did the value of the foreign currency reach its maximum, and what was that maximum value?

(Multiple Choice)
4.8/5 (34)
The graph below shows the numbers, in thousands, of men and women of a given height in a population.This graph allows us to conclude that: 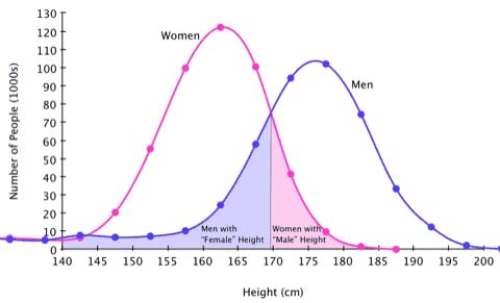
(Multiple Choice)
4.7/5 (31)
The graph below shows the blood-glucose levels, in milligrams per deciliter, as a function of hours since a meal was ingested.The three graphs are for a healthy person (labeled normal), a prediabetic, and a diabetic person.The graph indicates that regardless of diabetic condition, blood-glucose reaches a maximum concentration about how many hours after eating?
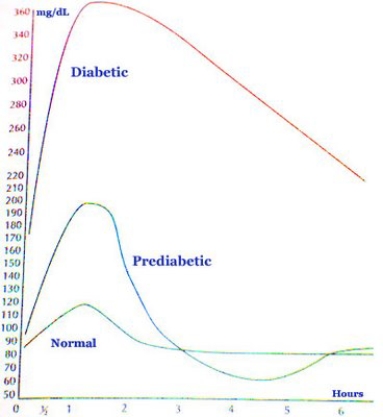
(Multiple Choice)
4.8/5 (32)
Below is a graph of a function  .Over what region(s) is the function increasing?
(Multiple Choice)
4.8/5 (39)
Filters
- Essay(0)
- Multiple Choice(0)
- Short Answer(0)
- True False(0)
- Matching(0)