Exam 2: Graphical Descriptive Techniques I
Exam 1: What Is Statistics43 Questions
Exam 2: Graphical Descriptive Techniques I93 Questions
Exam 3: Graphical Descriptive Techniques II183 Questions
Exam 4: Numerical Descriptive Techniques274 Questions
Exam 5: Data Collection and Sampling82 Questions
Exam 6: Probability234 Questions
Exam 7: Random Variables and Discrete Probability Distributions274 Questions
Exam 8: Continuous Probability Distributions215 Questions
Exam 9: Sampling Distributions153 Questions
Exam 10: Introduction to Estimation152 Questions
Exam 11: Introduction to Hypothesis Testing182 Questions
Exam 12: Inference About a Population147 Questions
Exam 13: Inference About Comparing Two Populations170 Questions
Exam 14: Analysis of Variance153 Questions
Exam 15: Chi-Squared Tests175 Questions
Exam 16: Simple Linear Regression and Correlation298 Questions
Exam 17: Multiple Regression157 Questions
Select questions type
Car Buyers
Forty car buyers were asked to indicate which car dealer offered the best overall service.The four choices were Contour Motors (C), Modern Chrysler (M), Tonneau Auto (T), and Uncanny Chevrolet (U).The following data were obtained:
 -{Car Buyers Narrative} Construct a pie chart of this data.Which car dealer offered the best overall service?
(Essay)
4.9/5  (40)
(40)
Suppose you measure the number of minutes it takes an employee to complete a task, where the maximum allowed time is 5 minutes, and each time is rounded to the nearest minute.Data from 130 employees is summarized below.How long did it take most employees to complete the task? 
(Multiple Choice)
4.9/5 (37)
Business School Graduates
A sample of business school graduates were asked what their major was.The results are shown in the following frequency distribution.
 -{Business School Graduates Narrative} Draw a pie chart of this data.Are you able to reconstruct the original data from this pie chart alone?
(Essay)
4.7/5 (31)
For what type of data are frequencies the only calculations that can be done?
(Multiple Choice)
4.8/5 (27)
Bar and pie charts are graphical techniques for nominal data.The former focus the attention on the frequency of the occurrences of each category, and the later emphasizes the proportion of occurrences of each category.
(True/False)
4.9/5 (33)
To describe the relationship between two nominal variables you make a scatter diagram and look for a correlation.
(True/False)
4.8/5 (31)
Suppose you measure the number of minutes it takes an employee to complete a task, where the maximum allowed time is 5 minutes, and each time is rounded to the nearest minute.Data from 130 employees is summarized below.Construct a frequency bar chart and a pie chart from this data.How long did it take most employees to complete the task?

(Essay)
4.8/5 (33)
Your age group (1-9; 10-19; 20-29; 30-39; etc.) is an interval variable.
(True/False)
4.8/5 (36)
A(n) ____________________ chart is not able to show frequencies.It can only show relative frequencies.
(Short Answer)
4.9/5 (34)
You cannot calculate and interpret differences between numbers assigned to ordinal data.
(True/False)
4.9/5 (37)
In the following cross-classification table, gender and car ownership are related.

(True/False)
4.9/5 (31)
Give an example of interval data that can also be treated as ordinal data and nominal data.
(Essay)
4.8/5 (44)
Values must represent ordered rankings for what type of data?
(Multiple Choice)
4.7/5 (29)
A cross-classification table summarizes data from two nominal variables.
(True/False)
4.8/5 (33)
The classification of student major (accounting, economics, management, marketing, other) is an example of a(n)
(Multiple Choice)
4.8/5 (45)
Two hundred males and two hundred females were asked whether or not college baseball should have a playoff system (yes/no/undecided).Pie charts of the responses for males vs.females are shown below.Which of the following describes the relationship between gender and opinion? 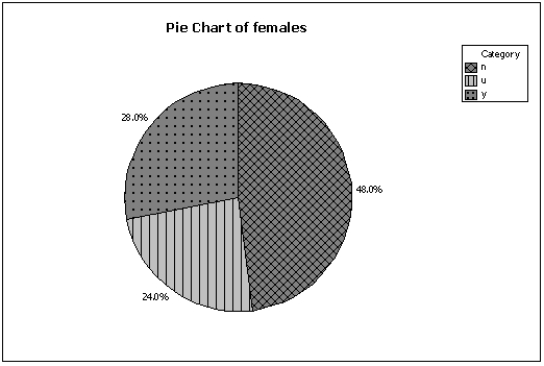
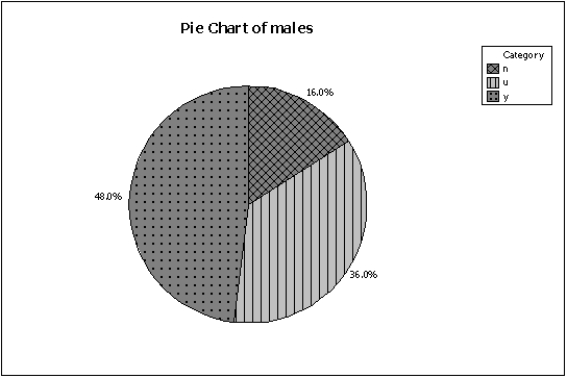
(Multiple Choice)
4.9/5 (33)
The bar charts below summarize data collected on 100 adults regarding gender and pet ownership.Which of the following statements is (are) true based on this chart? 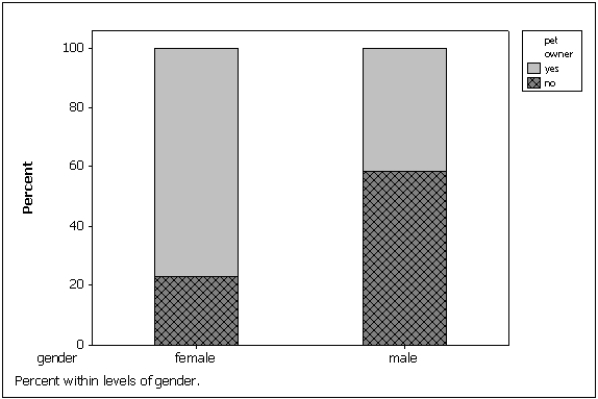
(Multiple Choice)
4.9/5 (36)
If two pie charts made from the rows of a cross-classification table look the same, then the two nominal variables ____________________ (are/are not) related.
(Short Answer)
4.9/5 (35)
Filters
- Essay(0)
- Multiple Choice(0)
- Short Answer(0)
- True False(0)
- Matching(0)