Exam 3: Graphical Descriptive Techniques II
Exam 1: What Is Statistics43 Questions
Exam 2: Graphical Descriptive Techniques I93 Questions
Exam 3: Graphical Descriptive Techniques II183 Questions
Exam 4: Numerical Descriptive Techniques274 Questions
Exam 5: Data Collection and Sampling82 Questions
Exam 6: Probability234 Questions
Exam 7: Random Variables and Discrete Probability Distributions274 Questions
Exam 8: Continuous Probability Distributions215 Questions
Exam 9: Sampling Distributions153 Questions
Exam 10: Introduction to Estimation152 Questions
Exam 11: Introduction to Hypothesis Testing182 Questions
Exam 12: Inference About a Population147 Questions
Exam 13: Inference About Comparing Two Populations170 Questions
Exam 14: Analysis of Variance153 Questions
Exam 15: Chi-Squared Tests175 Questions
Exam 16: Simple Linear Regression and Correlation298 Questions
Exam 17: Multiple Regression157 Questions
Select questions type
Possible methods of graphical deception include:
Free
(Multiple Choice)
4.7/5  (33)
(33)
Correct Answer: Verified
D
Time series data are often graphically depicted on a(n) ____________________, which is a plot of the variable of interest over time.
Free
(Short Answer)
4.9/5 (39)
Correct Answer:Verified
line chart
A skewed histogram is one with a long tail extending either to the right or left.
Free
(True/False)
4.8/5 (27)
Correct Answer:Verified
False
Slopes and trends in a line chart appear to be steeper if you ____________________ the horizontal (time) axis.
(Short Answer)
4.9/5 (44)
In a histogram a(n) ____________________ class is the one with the largest number of observations.
(Short Answer)
4.8/5 (34)
A pie chart showing 80% yes and 20% no would look the same whether it was based on 10,000 observations or 10 observations.This is one way that pie charts can be deceptive.
(True/False)
4.7/5 (35)
Credit Hours
The College of Business at The State University of California produced 3,400 credit hours during Spring Semester, 2011he number and percentage of credit hours produced by each of the four departments in the College of Business is shown below.
 The following three-dimensional pie chart was constructed from the table above.
 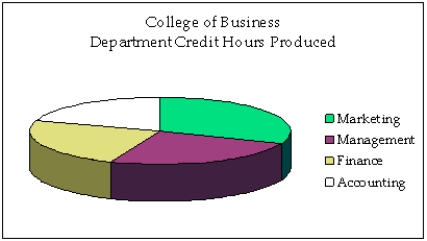 -{Credit Hours Narrative} Construct a two-dimensional pie chart showing the percentages of credit hours produced by the four departments.
(Essay)
4.7/5 (26)
An individual's income depends somewhat on their number of years of education.Accordingly, we identify income as the ____________________ variable, and years of education as the ____________________ variable.
(Short Answer)
4.8/5 (45)
If the form of the graph replaces the substance of the data, the graph is performing to function and graphical excellence is achieved.
(True/False)
4.8/5 (33)
In its 2000 report, a company presented the following data regarding its sales (in millions of dollars), and net income (in millions of dollars).
 The bar chart below was used to present these data.
 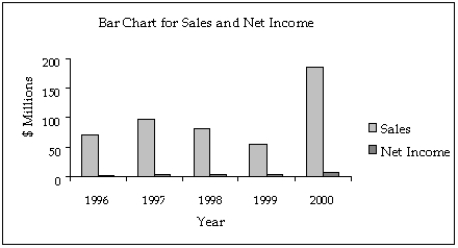 Assume that you are an unscrupulous statistician and want to make the data appear more positive than they really are.Redraw the graph by being selective about which years to include, getting the desired effect.
(Essay)
4.9/5 (45)
Which of the following statements about histograms is false?
(Multiple Choice)
5.0/5 (37)
A graph showing trends over time is called a(n) ____________________ chart.
(Short Answer)
4.9/5 (39)
The line chart below shows potato prices per pound for each month from January (month 1) to December last year.By looking at this chart you can see the lowest potato prices occurred in ____________________. 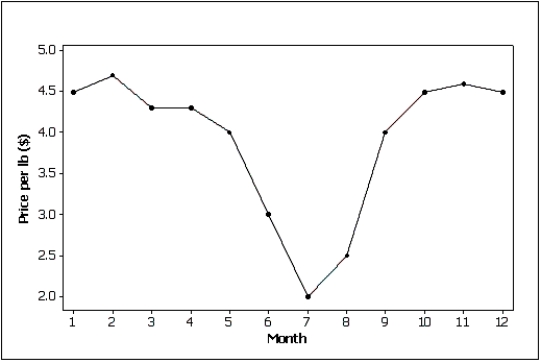
(Short Answer)
4.8/5 (26)
Graphical excellence gives the greatest number of ideas in the shortest time with the least ink in the smallest space.
(True/False)
4.8/5 (31)
Internet Classes
A survey of 25 students was conducted to determine how they rate the quality of Internet classes.Students were asked to rate the overall quality from 0 (no quality at all) to 100 (extremely good quality).The stem-and-leaf display of the data is shown below.
 -{Internet Classes Narrative} What percentage of the students rated the overall quality of Internet classes as being 70 or above?
(Short Answer)
4.7/5 (36)
Which of the following represents a graphical presentation of interval data?
(Multiple Choice)
4.7/5 (40)
Which of the following characteristics apply to achieve graphical excellence?
(Multiple Choice)
4.8/5 (42)
It is typical that when taking an exam, few students hand in their exams early; most prefer to reread their papers and hand them in near the end of the scheduled exam period.Under this scenario, a histogram of exam taking times is ____________________ skewed.
(Short Answer)
4.8/5 (35)
Electronics Company
At a meeting of regional offices managers of a national electronics company, a survey was taken to determine the number of employees the regional managers supervise in the operation of their departments.The results of the survey are shown below.
 -{Electronics Company Narrative} Across all of the regional offices, how many total employees were supervised by those surveyed?
(Essay)
4.8/5 (45)
Filters
- Essay(0)
- Multiple Choice(0)
- Short Answer(0)
- True False(0)
- Matching(0)