Exam 2: Graphical Descriptive Techniques I
Exam 1: What Is Statistics43 Questions
Exam 2: Graphical Descriptive Techniques I93 Questions
Exam 3: Graphical Descriptive Techniques II183 Questions
Exam 4: Numerical Descriptive Techniques274 Questions
Exam 5: Data Collection and Sampling82 Questions
Exam 6: Probability234 Questions
Exam 7: Random Variables and Discrete Probability Distributions274 Questions
Exam 8: Continuous Probability Distributions215 Questions
Exam 9: Sampling Distributions153 Questions
Exam 10: Introduction to Estimation152 Questions
Exam 11: Introduction to Hypothesis Testing182 Questions
Exam 12: Inference About a Population147 Questions
Exam 13: Inference About Comparing Two Populations170 Questions
Exam 14: Analysis of Variance153 Questions
Exam 15: Chi-Squared Tests175 Questions
Exam 16: Simple Linear Regression and Correlation298 Questions
Exam 17: Multiple Regression157 Questions
Select questions type
Using the following cross-classification table, draw two bar charts that compare pet ownership for males vs.females.Are gender and pet ownership related?

(Essay)
4.9/5  (33)
(33)
In the following cross-classification table, gender and fantasy baseball participation are related.

(True/False)
4.9/5 (34)
Identify the type of data for which each of the following graphs is appropriate.
a.
Pie chart
b.
Bar chart
(Short Answer)
4.7/5 (35)
If the relative frequencies in the rows of a cross-classification table are similar, then the two variables shown in the table are not related.
(True/False)
4.7/5 (32)
All-Nighters
A sample of 400 students at a certain university was taken after the midterm; 200 students reported staying up all night before the midterm and the other 200 students did not.Researchers recorded whether each student did well or poorly on the midterm.The following table contains the results.
Did Well on Did Poorly on
Midterm Midterm
Stayed up all night 60 140
Did not stay up all night 120 80
-{All-Nighters Narrative} Of those who did well on the midterm, what percentage stayed up all night before the midterm?
(Short Answer)
4.9/5 (35)
A survey of 100 adults was conducted to see if gender is related to pet ownership.The results are summarized in the bar chart below.Which of the following statements describes the relationship? 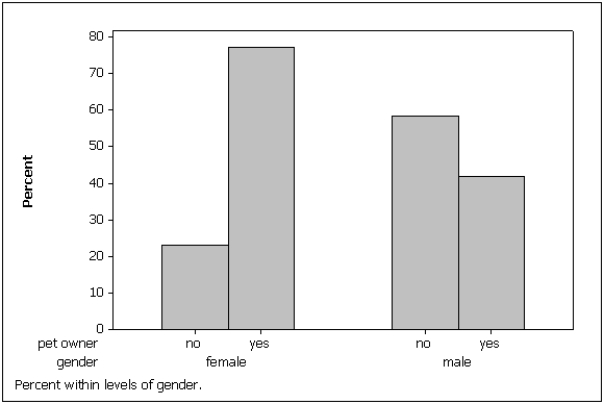
(Multiple Choice)
4.8/5 (27)
A(n) ____________________ distribution lists the categories of a nominal variable and the proportion with which each occurs.
(Short Answer)
4.8/5 (32)
Which of the following situations is best suited for a pie chart?
(Multiple Choice)
4.8/5 (35)
At the end of a safari, the tour guide asks the vacationers to respond to the questions listed below.For each question, determine whether the possible responses are interval, nominal, or ordinal.
a.
How many safaris have you taken prior to this one?
b.
Do you feel that your tour safari lasted sufficiently long (yes/no)?
c.
Which of the following features of the accommodations did you find most attractive: location, facilities, room size, service, or price?
d.
What is the maximum number of hours per day that you would like to spend traveling?
e.
Is your overall rating of this safari: excellent, good, fair, or poor?
(Short Answer)
4.8/5 (47)
Business School Graduates
A sample of business school graduates were asked what their major was.The results are shown in the following frequency distribution.
 -{Business School Graduates Narrative} If you were only given the frequency bar chart below, would you able to reconstruct the original observations in the data set?
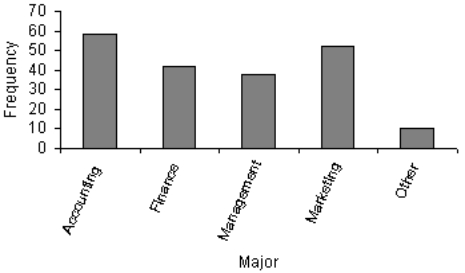
(Essay)
4.8/5 (37)
A category in a pie chart that contains 50% of the observations is represented by a slice of the pie that is equal to ____________________ degrees.
(Short Answer)
4.8/5 (30)
A frequency distribution lists the categories and the proportion with which each occurs.
(True/False)
4.9/5 (51)
Twenty-five voters participating in a recent election exit poll in Minnesota were asked to state their political party affiliation.Coding the data as R for Republican, D for Democrat, and I for Independent, the data collected were as follows: I, R, D, I, R, I, I, D, R, I, I, D, R, R, I, D, I, R, I, D, I, D, R, R, and I.Construct a frequency bar chart from this data.What does the bar chart tell you about the political affiliations of those in this sample?
(Essay)
4.7/5 (36)
A college professor classifies his students according to their grade point average (GPA) and their gender.The resulting cross-classification table is shown below.
 If you made a pie chart for male GPAs and a pie chart for female GPAs, those pie charts would look the same.
(True/False)
4.8/5 (30)
If two bar charts made from the rows of a cross-classification table look the same, then the two nominal variables ____________________ (are/are not) related.
(Short Answer)
4.9/5 (34)
Filters
- Essay(0)
- Multiple Choice(0)
- Short Answer(0)
- True False(0)
- Matching(0)