Exam 2: Frequency Distributions
Exam 1: An Introduction to Statistics and Research Design156 Questions
Exam 2: Frequency Distributions89 Questions
Exam 3: Visual Displays of Data108 Questions
Exam 4: Central Tendency and Variability108 Questions
Exam 5: Sampling and Probability145 Questions
Exam 6: The Normal Curve, Standardization and Z Scores142 Questions
Exam 7: Hypothesis Testing With Z Tests141 Questions
Exam 8: Confidence Intervals, Effect Size, and Statistical Power147 Questions
Exam 9: The Single-Sample T Test124 Questions
Exam 10: The Paired-Samples T Test101 Questions
Exam 11: The Independent-Samples T Test99 Questions
Exam 12: One-Way Between-Groups Anova108 Questions
Exam 13: One-Way Within-Groups Anova102 Questions
Exam 14: Two-Way Between-Groups Anova115 Questions
Exam 15: Correlation139 Questions
Exam 16: Regression113 Questions
Exam 17: Chi-Square Tess120 Questions
Exam 18: Choosing and Reporting Statistics105 Questions
Select questions type
For which situation is a grouped frequency table appropriate?
(Multiple Choice)
4.8/5  (36)
(36)
Use the following to answer questions
This histogram represents the distribution of the number of years of education completed by twins who attended the 16th Annual Twins Day Festival in Twinsburg, Ohio, in August of 1991.
Figure: Years of Education 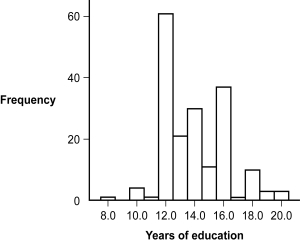 -(Figure: Years of Education) Based on the distribution, how many twins completed 13 years of education?
(Multiple Choice)
4.9/5 (38)
A negative skew may have a tail that indicates extreme scores _____ the center of the distribution.
(Multiple Choice)
4.7/5 (36)
Use the following to answer questions
This histogram represents the distribution of the number of years of education completed by twins who attended the 16th Annual Twins Day Festival in Twinsburg, Ohio, in August of 1991.
Figure: Years of Education
-(Figure: Years of Education) Based on the distribution, what is the number of years of education that was completed by most twins?
(Multiple Choice)
4.8/5 (33)
Of the different types of distributions, which distribution is described by a tail that extends to the left?
(Multiple Choice)
4.8/5 (34)
Use the following to answer questions
This polygon represents a fictional distribution of scores.
Figure: Frequency Polygon 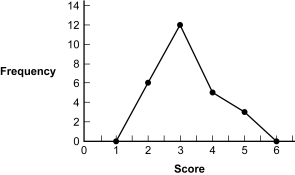 -(Figure: Frequency Polygon) Based on the frequency distribution, how many participants scored between 1 and 3?
(Multiple Choice)
4.7/5 (43)
A normal distribution is _____, while a skewed distribution is _____.
(Multiple Choice)
4.8/5 (41)
A _____ is a visual depiction of data that shows how often each value occurred.
(Multiple Choice)
4.9/5 (36)
Filters
- Essay(0)
- Multiple Choice(0)
- Short Answer(0)
- True False(0)
- Matching(0)