Exam 14: Multiple Regression and Model Building
Exam 1: An Introduction to Business Statistics63 Questions
Exam 2: Descriptive Statistics: Tabular and Graphical Methods100 Questions
Exam 3: Descriptive Statistics: Numerical Methods141 Questions
Exam 4: Probability127 Questions
Exam 5: Discrete Random Variables150 Questions
Exam 6: Continuous Random Variables145 Questions
Exam 7: Sampling and Sampling Distributions131 Questions
Exam 8: Confidence Intervals149 Questions
Exam 9: Hypothesis Testing150 Questions
Exam 10: Statistical Inferences Based on Two Samples139 Questions
Exam 11: Experimental Design and Analysis of Variance98 Questions
Exam 12: Chi-Square Tests112 Questions
Exam 13: Simple Linear Regression Analysis140 Questions
Exam 14: Multiple Regression and Model Building150 Questions
Exam 15: Process Improvement Using Control Charts117 Questions
Select questions type
Which of the following is not an assumption of the multiple linear regression model?
Free
(Multiple Choice)
4.8/5  (38)
(38)
Correct Answer: Verified
D
___________ is an iterative variable selection procedure that allows an independent variable to be added to a multiple regression model in one iteration and deleted during the next iteration.
Free
(Multiple Choice)
4.8/5 (36)
Correct Answer:Verified
B
Consider the following partial computer output for a multiple regression model. 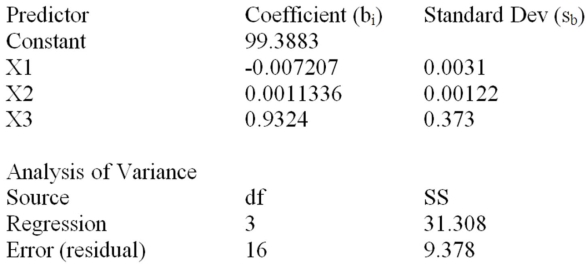 Calculate R2.
Free
(Short Answer)
4.8/5 (38)
Correct Answer:Verified
R2 = .7695
Below is a partial multiple regression ANOVA table. 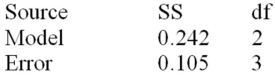 What are the total sum of squares,explained variation,mean square error,and the number of observations in the sample?
(Essay)
4.9/5 (32)
Consider the following partial computer output for a multiple regression model. 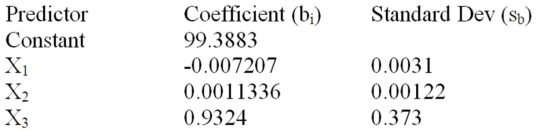 The calculated value of the t statistic for X1 is ________.
(Short Answer)
4.7/5 (37)
A member of the state legislature has expressed concern about the differences in the mathematics test scores of high school freshmen across the state.She asks her research assistant to conduct a study to investigate what factors could account for the differences.The research assistant looks at a random sample of school districts across the state and uses the factors of percentage of mathematics teachers in each district with a degree in mathematics,the average age of mathematics teachers,and the average salary of mathematics teachers. 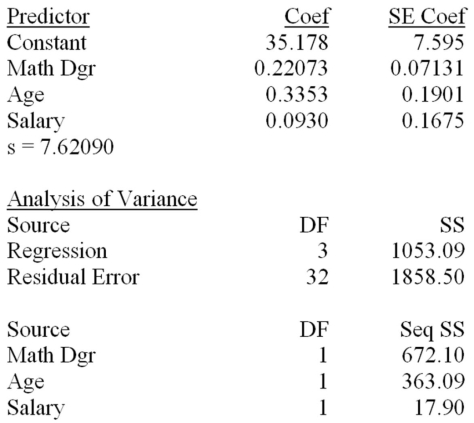 Based on the multiple regression model given above,estimate the mathematics test score and calculate the value of the residual,if the percentage of teachers with a mathematics degree is 50.0,the average age is 43,and the average salary is $48,300 (48.3).The actual mathematics test score for these factors is 68.50.
(Short Answer)
4.9/5 (37)
The manufacturer of a light fixture believes that the dollars spent on advertising,the price of the fixture,and the number of retail stores selling the fixture in a particular month influence the light fixture sales.The manufacturer randomly selects 10 months and collects the following data: 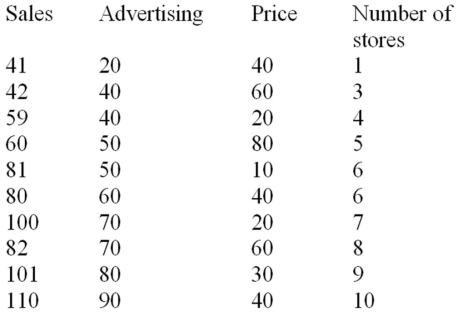 The sales are in thousands of units per month,the advertising is given in hundreds of dollars per month,and the price is the unit retail price for the particular month.Using MINITAB,the following computer output is obtained.
The regression equation is
Sales = 31.0 + 0.820 Advertising - 0.325 Price + 1.84 Stores
The sales are in thousands of units per month,the advertising is given in hundreds of dollars per month,and the price is the unit retail price for the particular month.Using MINITAB,the following computer output is obtained.
The regression equation is
Sales = 31.0 + 0.820 Advertising - 0.325 Price + 1.84 Stores 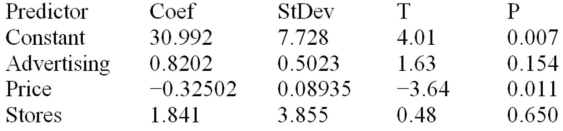

 Based on the multiple regression model given above,the point estimate of the monthly light fixture sales corresponding to second sample data is 49.82,or 49,820 units.This point estimate is calculated based on the assumption that the company spends $4000 on advertising,the price of the fixture is $60,and the fixture is being sold at 3 retail stores.Additional information related to this point estimate is given below.
  Calculate the 95 percent prediction interval for this point estimate and interpret the meaning of this interval.
(Essay)
4.9/5 (33)
The y-intercept (β0)in a multiple regression model represents the estimated value of the __________ variable,when the value of all independent variables are _________.
(Multiple Choice)
4.8/5 (46)
Consider the following partial computer output for a multiple regression model. 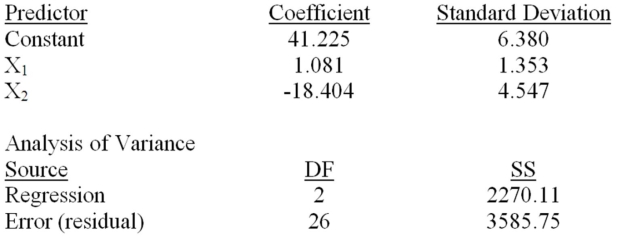 Calculate R2.
(Short Answer)
4.8/5 (38)
The range of feasible values for the multiple coefficient of correlation is from ________.
(Multiple Choice)
4.8/5 (33)
In a regression model,at any given combination of values of the independent variables,the population of potential error terms is assumed to have an F distribution.
(True/False)
4.7/5 (38)
The assumption of independent error terms in regression analysis is often violated when using time-series data.
(True/False)
4.7/5 (35)
The management of a professional baseball team is in the process of determining the budget for next year.A major component of future revenue is attendance at the home games.In order to predict attendance at home games,the team statistician has used a multiple regression model with dummy variables.The model is of the form y = β0 + β1x1 + β2x2 + β3x3 + ε,where:
y = attendance at a home game.
x1 = current power rating of the team on a scale from 0 to 100 before the game.
x2 and x3 are dummy variables,and they are defined below.
x2 = 1,if weekend,
x2 = 0,otherwise.
x3 = 1,if weather is favorable,
x3 = 0,otherwise.
After collecting the data,based on 30 games from last year,and implementing the above stated multiple regression model,the team statistician obtained the following least squares multiple regression equation: 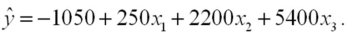 The multiple regression computer output also indicated the following:
 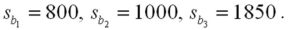 Interpret the estimated model coefficient b2.
(Essay)
5.0/5 (35)
Below is a partial multiple regression computer output.  Test the overall usefulness of the model at α = .01.Calculate the F statistic and make your decision.
(Essay)
4.9/5 (34)
Testing the contribution of individual independent variables with t tests is performed prior to the F test for the model in multiple regression analysis.
(True/False)
4.8/5 (32)
The _________ regression method is used when the response variable is a qualitative or a categorical variable.
(Multiple Choice)
4.8/5 (36)
A multiple linear regression analysis involving 45 observations resulted in the following least squares prediction equation: 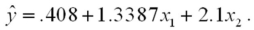 The SSE for this model is 49.Adding two other independent variables to the model resulted in the following multiple linear regression equation:
 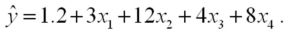 The SSE for the newer model is 40.At α = .05,test to determine if at least one of the two new independent variables make a significant contribution to the multiple regression model.
(Essay)
4.7/5 (45)
Below is a partial multiple regression ANOVA table. 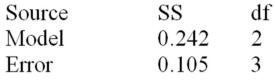 Calculate the adjusted R2.
(Short Answer)
4.8/5 (44)
Below is a partial multiple regression computer output based on a quadratic regression model. 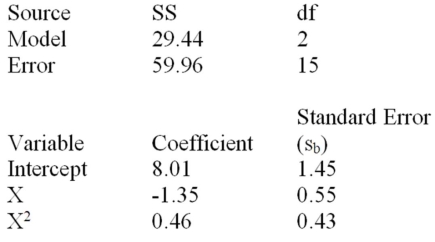 Calculate R2.
(Short Answer)
4.9/5 (37)
In a multiple regression model,the residuals were plotted against the values of one of the independent variables.The plot exhibited a funneling out pattern of residuals.This means that as the value of the independent variable increases,the error terms tend to ___________ and the model assumption of __________ is violated.
(Multiple Choice)
4.9/5 (36)
Filters
- Essay(0)
- Multiple Choice(0)
- Short Answer(0)
- True False(0)
- Matching(0)