Exam 14: Multiple Regression and Model Building
Exam 1: An Introduction to Business Statistics63 Questions
Exam 2: Descriptive Statistics: Tabular and Graphical Methods100 Questions
Exam 3: Descriptive Statistics: Numerical Methods141 Questions
Exam 4: Probability127 Questions
Exam 5: Discrete Random Variables150 Questions
Exam 6: Continuous Random Variables145 Questions
Exam 7: Sampling and Sampling Distributions131 Questions
Exam 8: Confidence Intervals149 Questions
Exam 9: Hypothesis Testing150 Questions
Exam 10: Statistical Inferences Based on Two Samples139 Questions
Exam 11: Experimental Design and Analysis of Variance98 Questions
Exam 12: Chi-Square Tests112 Questions
Exam 13: Simple Linear Regression Analysis140 Questions
Exam 14: Multiple Regression and Model Building150 Questions
Exam 15: Process Improvement Using Control Charts117 Questions
Select questions type
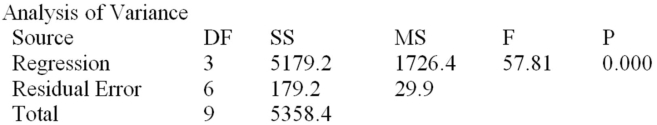
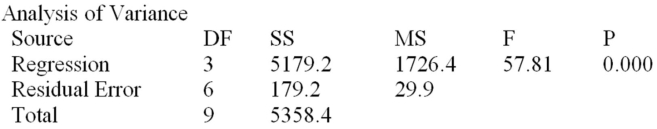
The manufacturer of a light fixture believes that the dollars spent on advertising,the price of the fixture,and the number of retail stores selling the fixture in a particular month influence the light fixture sales.The manufacturer randomly selects 10 months and collects the following data: 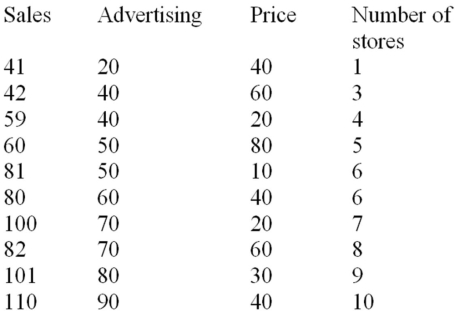 The sales are in thousands of units per month,the advertising is given in hundreds of dollars per month,and the price is the unit retail price for the particular month.Using MINITAB,the following computer output is obtained.
The regression equation is
Sales = 31.0 + 0.820 Advertising - 0.325 Price + 1.84 Stores
The sales are in thousands of units per month,the advertising is given in hundreds of dollars per month,and the price is the unit retail price for the particular month.Using MINITAB,the following computer output is obtained.
The regression equation is
Sales = 31.0 + 0.820 Advertising - 0.325 Price + 1.84 Stores 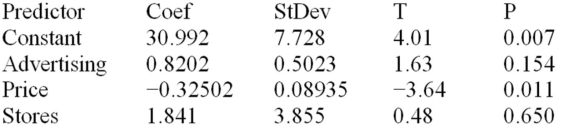

 Based on the multiple regression model given above,estimate the monthly light fixture sales and calculate the value of the residual,if the company spends $4000 on advertising,the price of the fixture is $60,and the fixture is being sold at 3 retail stores.
(Essay)
4.9/5  (32)
(32)
The management of a professional baseball team is in the process of determining the budget for next year.A major component of future revenue is attendance at the home games.In order to predict attendance at home games,the team statistician has used a multiple regression model with dummy variables.The model is of the form y = β0 + β1x1 + β2x2 + β3x3 + ε,where:
y = attendance at a home game.
x1 = current power rating of the team on a scale from 0 to 100 before the game.
x2 and x3 are dummy variables,and they are defined below.
x2 = 1,if weekend,
x2 = 0,otherwise.
x3 = 1,if weather is favorable,
x3 = 0,otherwise.
After collecting the data,based on 30 games from last year,and implementing the above stated multiple regression model,the team statistician obtained the following least squares multiple regression equation: 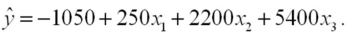 The multiple regression computer output also indicated the following:
 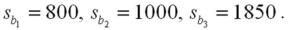 Assume that the overall model is useful in predicting game attendance.The team statistician wants to know if the mean attendance is higher on the weekends as compared to the weekdays.State the appropriate null and alternative hypotheses.
(Short Answer)
4.9/5 (42)
If we are predicting y when the values of the independent variables are x01,x02,... ,x0k,the farther the values of x01,x02,... ,x0k are from the center of the observed data,the smaller the distance value and the more precise the associated confidence and prediction intervals.
(True/False)
4.8/5 (36)
For a given multiple regression model with three independent variables,the value of the adjusted multiple coefficient of determination is _________ less than R2.
(Multiple Choice)
4.9/5 (33)
Consider the following partial computer output for a multiple regression model. 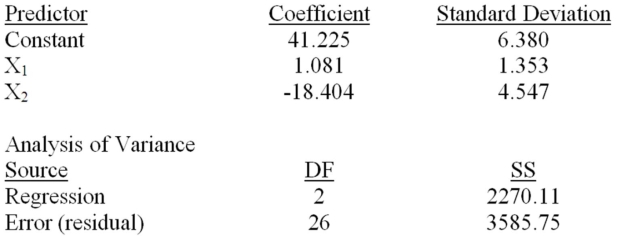 Determine the 95 percent interval for β2 and interpret its meaning.
(Essay)
5.0/5 (28)
In multiple regression analysis,which one of the following is the appropriate notation for error (residual)? 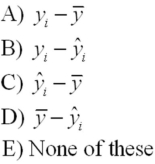
(Multiple Choice)
4.9/5 (35)
A partial F test is used to assess when at least one variable in a subset of squared and interaction variables in the multiple regression model is significant.
(True/False)
4.7/5 (33)
The manufacturer of a light fixture believes that the dollars spent on advertising,the price of the fixture,and the number of retail stores selling the fixture in a particular month influence the light fixture sales.The manufacturer randomly selects 10 months and collects the following data: 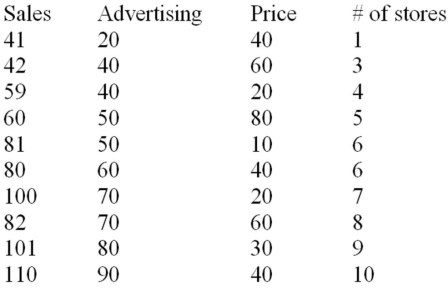 The sales are in thousands of units per month,the advertising is given in hundreds of dollars per month,and the price is the unit retail price for the particular month.Using MINITAB,the following computer output is obtained.
The regression equation is
Sales = 31.0 + 0.820 Advertising - 0.325 Price + 1.84 Stores
The sales are in thousands of units per month,the advertising is given in hundreds of dollars per month,and the price is the unit retail price for the particular month.Using MINITAB,the following computer output is obtained.
The regression equation is
Sales = 31.0 + 0.820 Advertising - 0.325 Price + 1.84 Stores 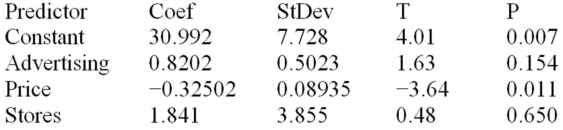

 Based on the multiple regression model given above,the point estimate of the monthly light fixture sales corresponding to second sample data is 49.82,or 49,820 units.This point estimate is calculated based on the assumption that the company spends $4000 on advertising,the price of the fixture is $60,and the fixture is being sold at 3 retail stores.Additional information related to this point estimate is given below.
  Test the usefulness of variable Price in the model,using the null hypothesis H0: β2 ≤ 0,at α = 0.05,and state your conclusions.
(Essay)
4.7/5 (26)
Assumptions of a regression model can be evaluated by plotting and analyzing the ____________.
(Multiple Choice)
4.9/5 (36)
Below is a partial multiple regression computer output. 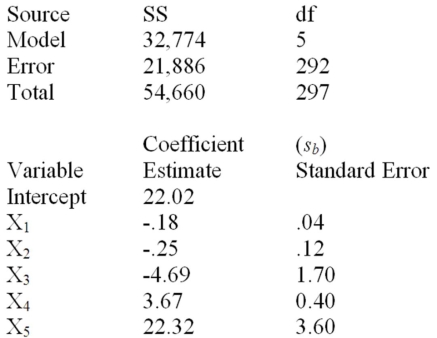 Write the least squares prediction equation.
(Essay)
4.9/5 (33)
In a multiple regression model,we can conclude that multicollinearity exists if the average variance inflation factor  is substantially greater than _____.
(Multiple Choice)
4.8/5 (31)
The graph of the prediction equation obtained from the model 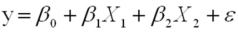 is a(n)__________.
(Multiple Choice)
4.7/5 (39)
A member of the state legislature has expressed concern about the differences in the mathematics test scores of high school freshmen across the state.She asks her research assistant to conduct a study to investigate what factors could account for the differences.The research assistant looks at a random sample of school districts across the state and uses the factors of percentage of mathematics teachers in each district with a degree in mathematics,the average age of mathematics teachers,and the average salary of mathematics teachers. 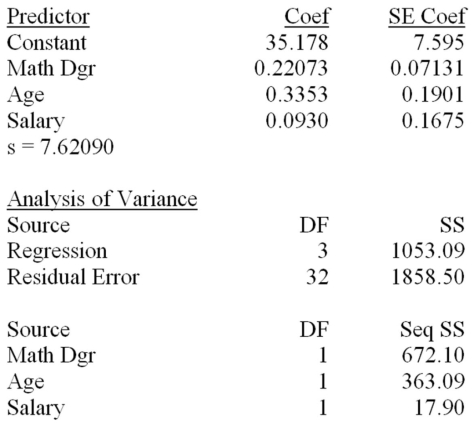 Additional information related to this point estimate of 65.12 is given below.
Predicted Values for New Observations:
Additional information related to this point estimate of 65.12 is given below.
Predicted Values for New Observations: 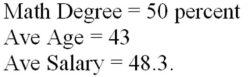 New
New 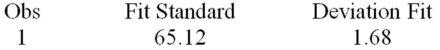 Determine the 95 percent confidence interval for this estimate and interpret its meaning.
(Essay)
4.9/5 (39)
Plotting the residuals in a time-ordered sequence will reveal possible violations of the __________ of error terms assumption.
(Multiple Choice)
4.9/5 (38)
Given the regression model y = β0 + β1x1 + β2x2 + β3x12 + β4x22 + ε,if we wish to test the significance of higher-order terms (x12 and x22),we would use the following test.
(Multiple Choice)
4.7/5 (40)
Multicollinearity is severe if the largest variance inflation factor (VIF)is greater than _____.
(Multiple Choice)
4.9/5 (35)
A member of the state legislature has expressed concern about the differences in the mathematics test scores of high school freshmen across the state.She asks her research assistant to conduct a study to investigate what factors could account for the differences.The research assistant looks at a random sample of school districts across the state and uses the factors of percentage of mathematics teachers in each district with a degree in mathematics,the average age of mathematics teachers,and the average salary of mathematics teachers.  Determine the 90 percent interval for β2 and interpret its meaning.
(Essay)
4.9/5 (34)
Below is a partial multiple regression computer output.  Test the usefulness of variable x5 in the model at α = .05.Calculate the t statistic and state your conclusions.
(Essay)
4.8/5 (36)
The variance inflation factor measures the relationship between the dependent variable and the rest of the independent variables in the regression model.
(True/False)
4.9/5 (31)
The manufacturer of a light fixture believes that the dollars spent on advertising,the price of the fixture,and the number of retail stores selling the fixture in a particular month influence the light fixture sales.The manufacturer randomly selects 10 months and collects the following data: 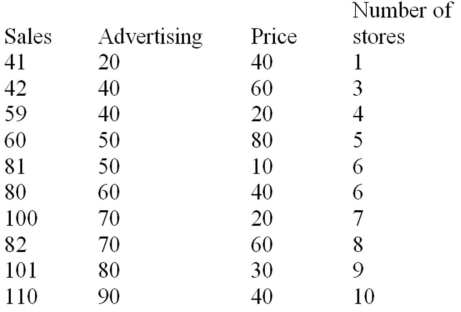 The sales are in thousands of units per month,the advertising is given in hundreds of dollars per month,and the price is the unit retail price for the particular month.Using MINITAB,the following computer output is obtained.
The regression equation is
Sales = 31.0 + 0.820 Advertising - 0.325 Price + 1.84 Stores
The sales are in thousands of units per month,the advertising is given in hundreds of dollars per month,and the price is the unit retail price for the particular month.Using MINITAB,the following computer output is obtained.
The regression equation is
Sales = 31.0 + 0.820 Advertising - 0.325 Price + 1.84 Stores 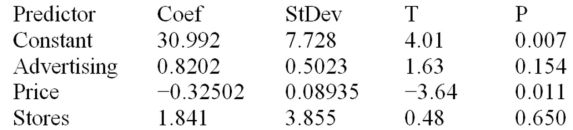

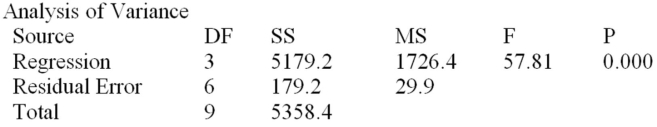 Interpret the regression coefficients for the variables Advertising,Price,and Store.
(Essay)
4.8/5 (31)
Filters
- Essay(0)
- Multiple Choice(0)
- Short Answer(0)
- True False(0)
- Matching(0)