Exam 14: Multiple Regression and Model Building
Exam 1: An Introduction to Business Statistics63 Questions
Exam 2: Descriptive Statistics: Tabular and Graphical Methods100 Questions
Exam 3: Descriptive Statistics: Numerical Methods141 Questions
Exam 4: Probability127 Questions
Exam 5: Discrete Random Variables150 Questions
Exam 6: Continuous Random Variables145 Questions
Exam 7: Sampling and Sampling Distributions131 Questions
Exam 8: Confidence Intervals149 Questions
Exam 9: Hypothesis Testing150 Questions
Exam 10: Statistical Inferences Based on Two Samples139 Questions
Exam 11: Experimental Design and Analysis of Variance98 Questions
Exam 12: Chi-Square Tests112 Questions
Exam 13: Simple Linear Regression Analysis140 Questions
Exam 14: Multiple Regression and Model Building150 Questions
Exam 15: Process Improvement Using Control Charts117 Questions
Select questions type
The normal plot is a residual plot that checks the normality assumption.
(True/False)
4.8/5  (29)
(29)
Regression models that employ more than one independent variable are referred to as multiple regression models.
(True/False)
4.8/5 (27)
When the quadratic regression model y = β0 + β1x + β2x2 + ε is used,the term β1 shows the rate of curvature of the parabola.
(True/False)
4.8/5 (34)
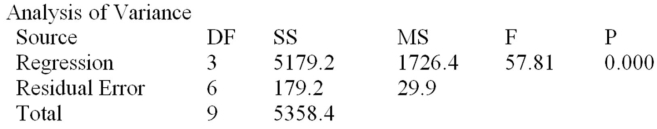
The manufacturer of a light fixture believes that the dollars spent on advertising,the price of the fixture and the number of retail stores selling the fixture in a particular month influence the light fixture sales.The manufacturer randomly selects 10 months and collects the following data: 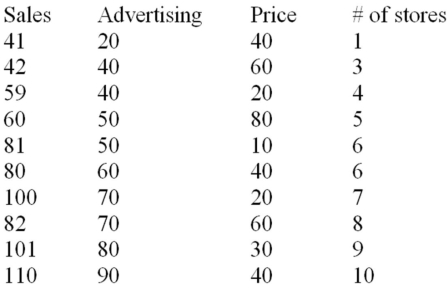 The sales are in thousands of units per month,the advertising is given in hundreds of dollars per month,and the price is the unit retail price for the particular month.Using MINITAB,the following computer output is obtained.
The regression equation is
Sales = 31.0 + 0.820 Advertising - 0.325 Price + 1.84 Stores
The sales are in thousands of units per month,the advertising is given in hundreds of dollars per month,and the price is the unit retail price for the particular month.Using MINITAB,the following computer output is obtained.
The regression equation is
Sales = 31.0 + 0.820 Advertising - 0.325 Price + 1.84 Stores 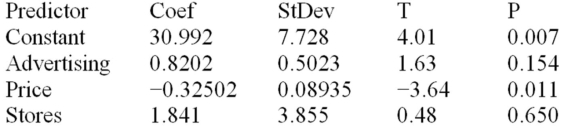

 Based on the multiple regression model given above,the point estimate of the monthly light fixture sales corresponding to second sample data is 49.82,or 49,820 units.This point estimate is calculated based on the assumption that the company spends $4000 on advertising,the price of the fixture is $60,and the fixture is being sold at 3 retail stores.Additional information related to this point estimate is given below.
  Determine the 95 percent confidence interval for this point estimate and interpret its meaning.
(Essay)
4.7/5 (31)
When the F test is used to test the overall significance of a multiple regression model,if the null hypothesis is rejected,it can be concluded that all of the independent variables x1,x2,... ,xk are significantly related to the dependent variable y.
(True/False)
4.8/5 (41)
An investigator hired by a client suing for sex discrimination has developed a multiple regression model for employee salaries for the company in question.In this multiple regression model,the salaries are in thousands of dollars.For example,a data entry of 35 for the dependent variable indicates a salary of $35,000.The indicator (dummy)variable for gender is coded as X1 = 0 if male and X1 = 1 if female.The computer output of this multiple regression model shows that the coefficient for this variable (X1)is -4.2.The t test showed that X1 was significant at α = 0.1.This result implies that for male and female workers of the company,
(Multiple Choice)
4.8/5 (44)
The graph of the prediction equation obtained from the model 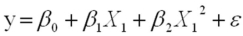 is a(n)____________.
(Multiple Choice)
4.8/5 (35)
If it is desired to include marital status in a multiple regression model by using the categories single,married,separated,divorced,and widowed,what will be the effect on the model?
(Multiple Choice)
4.8/5 (46)
Calculate the odds ratio for an event when its probability is 0.50.
(Short Answer)
4.8/5 (37)
Consider the following partial computer output for a multiple regression model. 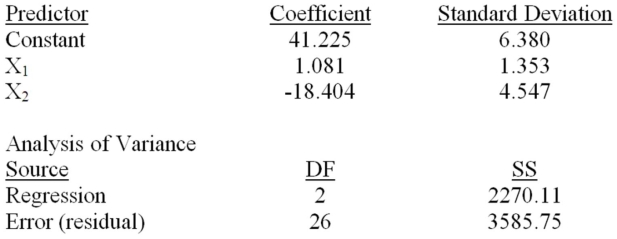 What is the mean square error?
(Short Answer)
4.8/5 (42)
Dummy or indicator variables typically are values of zero or one,and are used to model the effects of different levels of ___________ variables.
(Multiple Choice)
4.8/5 (36)
If a multiple regression model has a(n)____________ statistic substantially greater than k + 1,then it can be shown that this model has substantial bias and is undesirable.
(Multiple Choice)
4.8/5 (39)
Below is a partial multiple regression computer output. 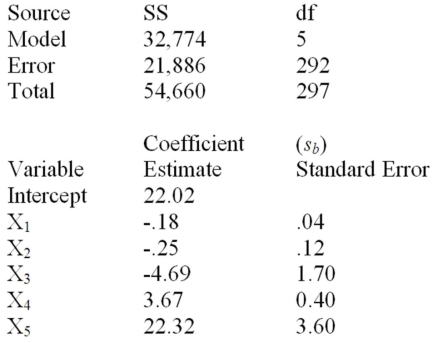 Determine the 95 percent interval for β4 and interpret its meaning.
(Essay)
4.9/5 (37)
The management of a professional baseball team is in the process of determining the budget for next year.A major component of future revenue is attendance at the home games.In order to predict attendance at home games,the team statistician has used a multiple regression model with dummy variables.The model is of the form y = β0 + β1x1 + β2x2 + β3x3 + ε,where:
y = attendance at a home game.
x1 = current power rating of the team on a scale from 0 to 100 before the game.
x2 and x3 are dummy variables,and they are defined below.
x2 = 1,if weekend,
x2 = 0,otherwise.
x3 = 1,if weather is favorable,
x3 = 0,otherwise.
After collecting the data,based on 30 games from last year,and implementing the above stated multiple regression model,the team statistician obtained the following least squares multiple regression equation: 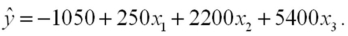 The multiple regression computer output also indicated the following:
 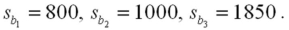 Assume that the overall model is useful in predicting the game attendance.The team statistician wants to know if the mean attendance is higher on the weekends as compared to the weekdays.At α = .05,test to determine if the attendance is higher at weekend home games.
(Essay)
4.8/5 (39)
Backward elimination regression is an automatic model-building procedure.
(True/False)
4.8/5 (32)
The multiple coefficient of determination that relates x2 to all the other independent variables R2(x2)= .94.Calculate the variance inflation factor for x2.Should the analyst be concerned about multicollinearity? Why or why not?
(Essay)
5.0/5 (34)
In a multiple regression mode,if the largest variance inflation factor (VIF)is 21.6,then it can be concluded that there are indications of multicollinearity.
(True/False)
4.9/5 (28)
Consider the following partial computer output for a multiple regression model. 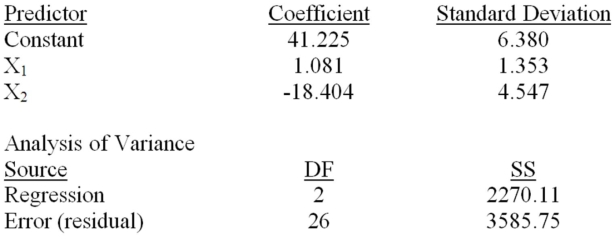 Calculate the adjusted R2.
(Short Answer)
4.7/5 (31)
An application of the multiple regression model generated the following results involving the F test of the overall regression model: p-value = .0012,R2 = .67,and s = .076.Thus,the null hypothesis,which states that none of the independent variables are significantly related to the dependent variable,should be rejected at the .05 level of significance.
(True/False)
4.8/5 (31)
Below is a partial multiple regression computer output based on a quadratic regression model to predict student enrollment at a local university.The dependent variable is the annual enrollment,given in thousands of students.The independent variable X is the increase in tuition stated in thousands of dollars per year,and X2 is the square of the tuition increase given in squared thousands of dollars per year.Interpret β0 (the y-intercept)and β1 (the β coefficient for the X variable).Does the parabola open upward or downward? Why? 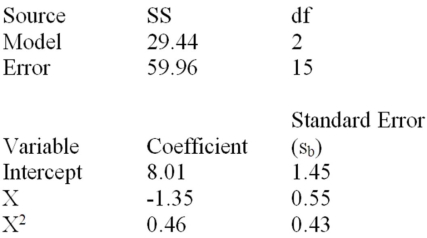
(Essay)
4.8/5 (39)
Filters
- Essay(0)
- Multiple Choice(0)
- Short Answer(0)
- True False(0)
- Matching(0)