Exam 14: Multiple Regression and Model Building
Exam 1: An Introduction to Business Statistics63 Questions
Exam 2: Descriptive Statistics: Tabular and Graphical Methods100 Questions
Exam 3: Descriptive Statistics: Numerical Methods141 Questions
Exam 4: Probability127 Questions
Exam 5: Discrete Random Variables150 Questions
Exam 6: Continuous Random Variables145 Questions
Exam 7: Sampling and Sampling Distributions131 Questions
Exam 8: Confidence Intervals149 Questions
Exam 9: Hypothesis Testing150 Questions
Exam 10: Statistical Inferences Based on Two Samples139 Questions
Exam 11: Experimental Design and Analysis of Variance98 Questions
Exam 12: Chi-Square Tests112 Questions
Exam 13: Simple Linear Regression Analysis140 Questions
Exam 14: Multiple Regression and Model Building150 Questions
Exam 15: Process Improvement Using Control Charts117 Questions
Select questions type
Below is a partial multiple regression computer output based on a quadratic regression model. 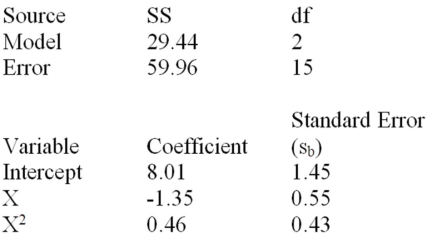 Test the usefulness of the variable X in the model at α = .05.
(Short Answer)
4.8/5  (35)
(35)
Consider the following partial computer output for a multiple regression model. 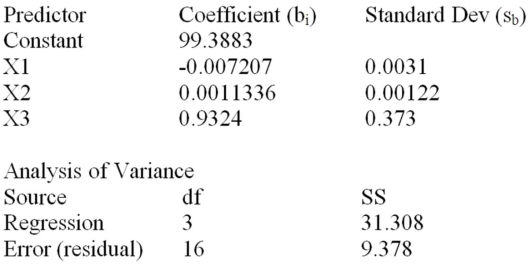 How many observations were taken?
(Short Answer)
4.9/5 (31)
Because multiple regression models consist of multiple independent variables,residual analysis cannot be performed.
(True/False)
4.9/5 (20)
For the same point estimate of the dependent variable and the same level of significance,the confidence interval is always wider than the corresponding prediction interval.
(True/False)
4.9/5 (28)
It is appropriate to use an interaction variable if the relationship between the dependent variable and one of the independent variables depends on the value of the other independent variable.
(True/False)
4.7/5 (31)
In the quadratic regression model 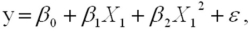 if the term β2 is ___________ zero,then the parabola opens ____________.
(Multiple Choice)
4.9/5 (36)
The primary use of stepwise regression is to identify the most important ___________ that should be included in the multiple regression model.
(Multiple Choice)
4.9/5 (31)
The error term in the regression model describes the effects of all factors other than the independent variables on y (response variable).
(True/False)
4.8/5 (39)
The multiple _________ measures the proportion of the variation in y (response variable)explained by the multiple regression model or the set of independent variables included in the multiple regression equation.
(Multiple Choice)
4.8/5 (40)
Below is a portion of a logistic regression table showing the probability of an employee leaving his or her current position: 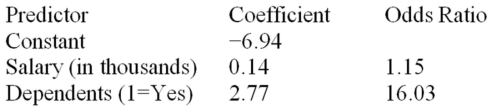 Estimate the probability of an employee (dependent variable)leaving his or her current position (1 = yes)when the current salary is $36,000 and the employee has dependents.
(Short Answer)
4.8/5 (26)
Which one of the following tools is not used to check the normality of residuals assumption for a multiple regression model?
(Multiple Choice)
4.8/5 (34)
Consider the following partial computer output for a multiple regression model. 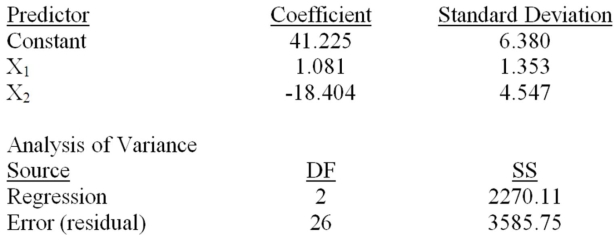 What is the explained variation?
(Short Answer)
4.8/5 (42)
In using the multiple regression method,we can model the effects of the different levels of a qualitative independent variable by using a(n)____________.
(Multiple Choice)
4.7/5 (33)
Consider the following partial computer output for a multiple regression model. 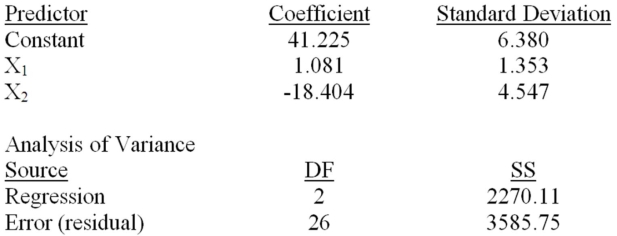 Test the usefulness of variable x2 in the model at α = .05.Calculate the t statistic and state your conclusions.
(Essay)
4.8/5 (39)
A member of the state legislature has expressed concern about the differences in the mathematics test scores of high school freshmen across the state.She asks her research assistant to conduct a study to investigate what factors could account for the differences.The research assistant looks at a random sample of school districts across the state and uses the factors of percentage of mathematics teachers in each district with a degree in mathematics,the average age of mathematics teachers,and the average salary of mathematics teachers 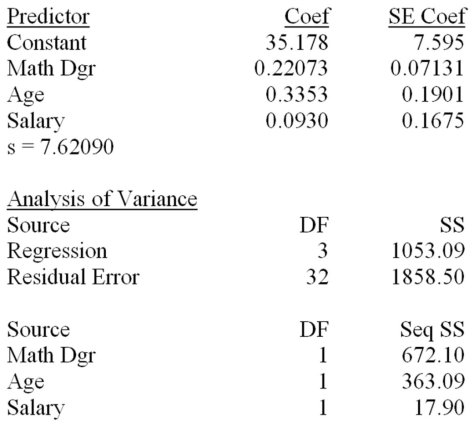 Additional information related to this point estimate of 65.12 is given below.
Predicted Values for New Observations:
Additional information related to this point estimate of 65.12 is given below.
Predicted Values for New Observations: 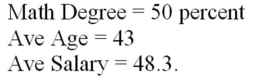 New
New 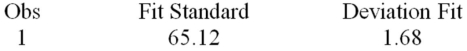 Calculate the 95 percent prediction interval for this point estimate.
(Short Answer)
4.9/5 (28)
In using a regression model,if a new independent variable is added,the value of R2 (the coefficient of multiple determination)will ___________ decrease.
(Multiple Choice)
4.9/5 (31)
The multiple coefficient of determination that relates x3 to all the other independent variables R2(x3)= .8.Calculate the variance inflation factor for x3.Should the analyst be concerned about multicollinearity? Why or why not?
(Essay)
4.9/5 (26)
The effects of different levels of qualitative independent variables are described using ___________ variables.
(Multiple Choice)
4.9/5 (39)
Filters
- Essay(0)
- Multiple Choice(0)
- Short Answer(0)
- True False(0)
- Matching(0)