Exam 2: Descriptive Statistics: Tabular and Graphical Methods
Exam 1: An Introduction to Business Statistics63 Questions
Exam 2: Descriptive Statistics: Tabular and Graphical Methods100 Questions
Exam 3: Descriptive Statistics: Numerical Methods141 Questions
Exam 4: Probability127 Questions
Exam 5: Discrete Random Variables150 Questions
Exam 6: Continuous Random Variables145 Questions
Exam 7: Sampling and Sampling Distributions131 Questions
Exam 8: Confidence Intervals149 Questions
Exam 9: Hypothesis Testing150 Questions
Exam 10: Statistical Inferences Based on Two Samples139 Questions
Exam 11: Experimental Design and Analysis of Variance98 Questions
Exam 12: Chi-Square Tests112 Questions
Exam 13: Simple Linear Regression Analysis140 Questions
Exam 14: Multiple Regression and Model Building150 Questions
Exam 15: Process Improvement Using Control Charts117 Questions
Select questions type
A CFO is looking at how much the company is spending on computing.He samples companies in the pharmaceutical industry and develops the following stem-and-leaf graph. 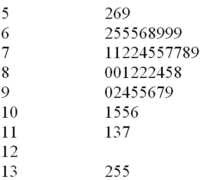 If you were creating a frequency histogram using these data,how many classes would you create?
Free
(Multiple Choice)
4.9/5  (26)
(26)
Correct Answer: Verified
C
All of the following are used to describe quantitative data except the ___________.
Free
(Multiple Choice)
4.9/5 (35)
Correct Answer:Verified
D
A scatter plot can be used to identify outliers.
Free
(True/False)
4.8/5 (33)
Correct Answer:Verified
False
A CFO is looking at how much the company is spending on computing.He samples companies in the pharmaceutical industry and develops the following stem-and-leaf graph.  What would be the class length used in creating a frequency histogram?
(Multiple Choice)
4.9/5 (35)
The following is a relative frequency distribution of grades in an introductory statistics course. 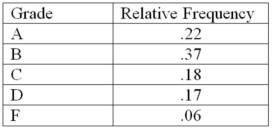 If this was the distribution of 200 students,find the frequency for the highest two grades.
(Multiple Choice)
4.9/5 (35)
The following is a relative frequency distribution of grades in an introductory statistics course.  If we wish to depict these data using a pie chart,find how many degrees (out of 360 degrees)should be assigned to each grade.
(Essay)
4.9/5 (28)
Consider the following data on distances traveled by people to visit the local amusement park. 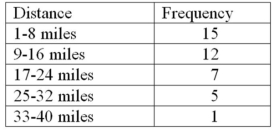 Construct an ogive plot that corresponds to the frequency table.
(Essay)
4.8/5 (25)
Consider the following data on distances traveled by people to visit the local amusement park and calculate the relative frequency for the distances over 24 miles. 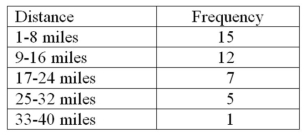
(Multiple Choice)
4.9/5 (35)
The US local airport keeps track of the percentage of flights arriving within 15 minutes of their scheduled arrivals.The stem-and-leaf plot of the data for one year is below. 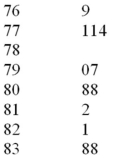 In developing a histogram of these data,how many classes would be used?
(Multiple Choice)
4.8/5 (29)
The number of weekly sales calls by a sample of 25 pharmaceutical salespersons is below.
24,56,43,35,37,27,29,44,34,28,33,28,46,31,38,41,48,38,27,29,37,33,31,40,50
Construct a histogram.
(Essay)
4.9/5 (30)
If there are 62 values in a data set,how many classes should be created for a frequency histogram?
(Multiple Choice)
4.8/5 (26)
A histogram that tails out toward smaller values is ___________.
(Multiple Choice)
4.8/5 (43)
When constructing any graphical display that utilizes categorical data,classes that have frequencies of 5 percent or less are usually combined together into a single category.
(True/False)
4.9/5 (33)
In a Pareto chart,the bar for the OTHER category should be placed to the far left of the chart.
(True/False)
4.9/5 (34)
The number of weekly sales calls by a sample of 25 pharmaceutical salespersons is below.
24,56,43,35,37,27,29,44,34,28,33,28,46,31,38,41,48,38,27,29,37,33,31,40,50
Construct a stem-and-leaf plot.
(Essay)
4.9/5 (27)
Recently an advertising company called 200 people and asked them to identify the company that was in an ad running nationwide.The following results were obtained. 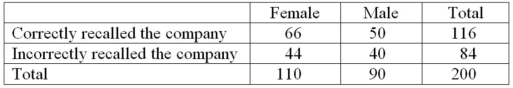 What percentage of those surveyed were female and could not recall the company?
(Multiple Choice)
4.8/5 (37)
________ can be used to study the relationship between two variables.
(Multiple Choice)
4.7/5 (31)
If there are 130 values in a data set,how many classes should be created for a frequency histogram?
(Multiple Choice)
4.9/5 (25)
Splitting the stems refers to assigning the same stem to two or more rows of the stem-and-leaf display.
(True/False)
4.9/5 (35)
When data are qualitative,the bars should never be separated by gaps.
(True/False)
4.8/5 (28)
Filters
- Essay(0)
- Multiple Choice(0)
- Short Answer(0)
- True False(0)
- Matching(0)