Exam 15: Process Improvement Using Control Charts
Exam 1: An Introduction to Business Statistics63 Questions
Exam 2: Descriptive Statistics: Tabular and Graphical Methods100 Questions
Exam 3: Descriptive Statistics: Numerical Methods141 Questions
Exam 4: Probability127 Questions
Exam 5: Discrete Random Variables150 Questions
Exam 6: Continuous Random Variables145 Questions
Exam 7: Sampling and Sampling Distributions131 Questions
Exam 8: Confidence Intervals149 Questions
Exam 9: Hypothesis Testing150 Questions
Exam 10: Statistical Inferences Based on Two Samples139 Questions
Exam 11: Experimental Design and Analysis of Variance98 Questions
Exam 12: Chi-Square Tests112 Questions
Exam 13: Simple Linear Regression Analysis140 Questions
Exam 14: Multiple Regression and Model Building150 Questions
Exam 15: Process Improvement Using Control Charts117 Questions
Select questions type
For a given control chart,zone boundaries consist of the UCL and LCL.
Free
(True/False)
4.9/5  (49)
(49)
Correct Answer: Verified
False
How well a product or a service performs in the marketplace is called the quality of ______________.
Free
(Multiple Choice)
4.9/5 (36)
Correct Answer:Verified
A
Control charts are used to reduce common causes of variation.
Free
(True/False)
4.8/5 (33)
Correct Answer:Verified
False
A systematic method for analyzing process data in which we monitor process variation is called ______________.
(Multiple Choice)
4.9/5 (35)
A fastener company produces bolts with a nominal (target)length of 2.00 inches.The specifications are 2.00 ± .006 inches.If the process mean is 2.001 and the process standard deviation is .0016,determine the estimated standard deviations of the leeway for this process.
(Multiple Choice)
4.9/5 (44)
A manufacturer of windows produces one type that has a plastic coating.The specification limits for the plastic coating are 30 and 70.From time to time the plastic coating can become uneven.Therefore,in order to keep the coating as even as possible,thickness measurements are periodically taken at four different locations on the window.15 subgroups were observed,each consisting of four thickness measurements,with the following results: mean of the means =  = 50.05,and average range = 8.85.Calculate the center line for the X-bar chart.
(Multiple Choice)
4.9/5 (35)
A bank officer wishes to study how many customers write bad checks.To accomplish this,the officer randomly selects a weekly sample of 100 checking accounts and records the number that wrote bad checks.The numbers of customers who wrote bad checks in 20 consecutive weekly samples of 100 account holders are,respectively,1,4,9,0,4,6,0,3,8,5,3,5,2,9,4,4,3,6,4,and 0.Find the LCL and UCL for the p chart.
(Multiple Choice)
4.9/5 (37)
A fastener company produces bolts with a nominal (target)length of 2.00 inches.The specifications are 2.00 ± .006 inches.Determine the upper specification limit and the lower specification limit for this process.
(Multiple Choice)
4.8/5 (41)
Use this information about 10 shipments of lightbulbs:  If 200 lightbulbs are selected at random from each of 10 shipments and the number of defectives in each shipment is given above,find the LCL and the UCL for the p chart.
(Multiple Choice)
4.9/5 (37)
A manufacturer of windows produces one type that has a plastic coating.The specification limits for the plastic coating are 30 and 70.From time to time the plastic coating can become uneven.Therefore,to keep the coating as even as possible,thickness measurements are periodically taken at four different locations on the window.15 subgroups were observed,each consisting of four thickness measurements,with the following results: mean of the means =  = 50.05,and average range of 8.85.Is the process capable of meeting the specifications?
(Multiple Choice)
4.8/5 (38)
_________ is the set of international standards on quality management and quality assurance systems.It establishes processes for assuring that goods and services offered by the company meet a consistent level of quality acceptable to customers.
(Multiple Choice)
4.7/5 (31)
Which of the following control charts is designed to control the proportion of nonconforming units?
(Multiple Choice)
4.8/5 (43)
If  = 2.0144,
  = .0972,and there are 25 subgroups of size 5,find the UCL and the LCL for the R chart.
(Multiple Choice)
4.8/5 (31)
A control chart on which the proportions of nonconforming units in subgroups of size n are plotted versus time is a(n)_____ chart.
(Multiple Choice)
4.8/5 (39)
If ![If = 16.1, = .03,and n = 6,and if the specifications are [15.9,16.3],is the process capable?](https://storage.examlex.com/TB1736/11eb06d7_5567_235c_8177_4b015018807f_TB1736_11.jpg) = 16.1,
= 16.1, ![If = 16.1, = .03,and n = 6,and if the specifications are [15.9,16.3],is the process capable?](https://storage.examlex.com/TB1736/11eb06d7_5567_bf9d_8177_999d7e2aa018_TB1736_11.jpg) = .03,and n = 6,and if the specifications are [15.9,16.3],is the process capable?
= .03,and n = 6,and if the specifications are [15.9,16.3],is the process capable?
(Multiple Choice)
4.8/5 (34)
Suppose that  and R charts based on subgroups of size 4 are being used to monitor the tire diameter of a new radial tire.The
  andR charts are found to be in statistical control with
 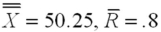 inches.A histogram of the tire diameter measurements indicates that these measurements are approximately normally distributed.If the tire diameter specifications are 50 inches ± 1 inch,is the process capable of meeting the specifications?
(Multiple Choice)
4.9/5 (49)
A range chart is a control chart on which ranges between individual process measurements within a subgroup are plotted.
(True/False)
4.9/5 (36)
If  = 16.1,
  = .03,and n = 6,calculate the natural tolerance limits.
(Multiple Choice)
4.8/5 (23)
When employing measurement data to study a process,the ____________ monitors the process mean.
(Multiple Choice)
4.8/5 (39)
A foreman wants to use an  chart to control the average length of the bolts manufactured.He has recently collected the six samples given below.
 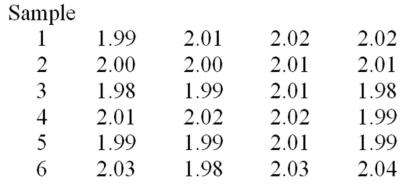 Calculate the mean of the means
(Multiple Choice)
4.9/5 (36)
Filters
- Essay(0)
- Multiple Choice(0)
- Short Answer(0)
- True False(0)
- Matching(0)