Exam 3: Descriptive Statistics: Numerical Methods
Exam 1: An Introduction to Business Statistics63 Questions
Exam 2: Descriptive Statistics: Tabular and Graphical Methods100 Questions
Exam 3: Descriptive Statistics: Numerical Methods141 Questions
Exam 4: Probability127 Questions
Exam 5: Discrete Random Variables150 Questions
Exam 6: Continuous Random Variables145 Questions
Exam 7: Sampling and Sampling Distributions131 Questions
Exam 8: Confidence Intervals149 Questions
Exam 9: Hypothesis Testing150 Questions
Exam 10: Statistical Inferences Based on Two Samples139 Questions
Exam 11: Experimental Design and Analysis of Variance98 Questions
Exam 12: Chi-Square Tests112 Questions
Exam 13: Simple Linear Regression Analysis140 Questions
Exam 14: Multiple Regression and Model Building150 Questions
Exam 15: Process Improvement Using Control Charts117 Questions
Select questions type
The local amusement park was interested in the average wait time at their most popular roller coaster at the peak park time (2 p.m. ).They selected 13 patrons and had them get in line between 2 and 3 p.m.Each was given a stopwatch to record the time they spent in line.The times recorded were as follows (in minutes;mean = 114.15): 118,124,108,116,99,120,148,118,119,121,45,130,118.
What is the variance?
(Multiple Choice)
4.9/5  (38)
(38)
The line that minimizes the sum of the squared horizontal (x)distances between the points on the scatter plot and the line is the least squares line.
(True/False)
4.9/5 (25)
The local amusement park was interested in the average wait time at their most popular roller coaster at the peak park time (2 p.m. ).They selected 13 patrons and had them get in line between 2 and 3 p.m.Each was given a stopwatch to record the time they spent in line.The times recorded were as follows (in minutes). 118,124,108,116,99,120,148,118,119,121,45,130,118
What is the IQR?
(Multiple Choice)
4.8/5 (38)
When using Chebyshev's Theorem to obtain the bounds for 99.73 percent of the values in a population,the interval generally will be ___________ the interval obtained for the same percentage if a normal distribution is assumed (Empirical Rule).
(Multiple Choice)
4.8/5 (32)
In a hearing test,subjects estimate the loudness (in decibels)of a sound,and the results are (mean = 70): 68,67,70,71,68,75,68,62,80,73,68.
What is the variance?
(Multiple Choice)
4.8/5 (31)
Using Chebyshev's Theorem,approximate the minimum proportion of the data that will be within μ ± kσ for k = 3.2.
(Multiple Choice)
4.8/5 (41)
The population variance is the average of the squared deviations of the individual population measurements from the population mean.
(True/False)
4.8/5 (36)
Using Chebyshev's Theorem,find the interval that contains at least 93.75 percent of all measurements when the mean = 2.549 and s = 1.828.
(Multiple Choice)
4.9/5 (37)
A random sample of 60 students in the business statistics course answered a survey on the average number of hours they spent on statistics each week.Unfortunately,the original data were lost and all that remains is the frequency table below.From these data,calculate the estimated sample standard deviation. 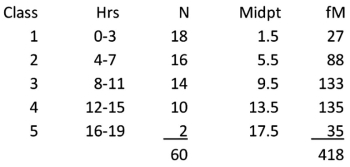
(Short Answer)
4.7/5 (33)
A quantity that measures the variation of a population or a sample relative to its mean is called the ____________.
(Multiple Choice)
4.9/5 (37)
In the calculation of a mean for grouped data,we assume that the average of the measurements in each class equals the class midpoint.
(True/False)
4.8/5 (37)
The company financial officer was interested in the average cost of PCs that had been purchased in the past six months.She took a random sample of the price of 10 computers,with the following results. $3,250,$1,127,$2,995,$3,250,$3,445,$3,449,$1,482,$6,120,$3,009,$4,000
What is the first quartile?
(Multiple Choice)
4.8/5 (43)
In a study of the factors that affect success in economics,data were collected for 8 business students.Scores on a calculus placement test are given with economics final exam scores.The data are below. 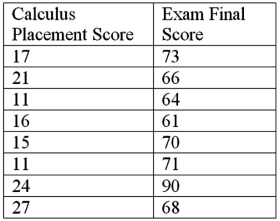 It can be shown that for these data:
  140.75. Calculate the sample correlation coefficient.
(Multiple Choice)
4.9/5 (43)
In a hearing test,subjects estimate the loudness (in decibels)of a sound,and the results are (mean = 70): 68,67,70,71,68,75,68,62,80,73,68.
What is the standard deviation?
(Multiple Choice)
4.7/5 (34)
According to Chebyshev's Theorem,at least what proportion of the data will be within μ ± kσ for k = 2?
(Multiple Choice)
4.9/5 (34)
Find the weighted mean per capita income for the following random sample of six cities in the Midwest. 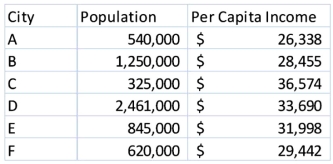
(Short Answer)
4.8/5 (31)
Find the coefficient of variation for IQ tests with a mean of 100 and a standard deviation of 15.
(Multiple Choice)
4.9/5 (42)
Find the z-score for an IQ test score of 125 when the mean is 100 and the standard deviation is 15.
(Multiple Choice)
4.9/5 (38)
Filters
- Essay(0)
- Multiple Choice(0)
- Short Answer(0)
- True False(0)
- Matching(0)