Exam 3: Descriptive Statistics: Numerical Methods
Exam 1: An Introduction to Business Statistics63 Questions
Exam 2: Descriptive Statistics: Tabular and Graphical Methods100 Questions
Exam 3: Descriptive Statistics: Numerical Methods141 Questions
Exam 4: Probability127 Questions
Exam 5: Discrete Random Variables150 Questions
Exam 6: Continuous Random Variables145 Questions
Exam 7: Sampling and Sampling Distributions131 Questions
Exam 8: Confidence Intervals149 Questions
Exam 9: Hypothesis Testing150 Questions
Exam 10: Statistical Inferences Based on Two Samples139 Questions
Exam 11: Experimental Design and Analysis of Variance98 Questions
Exam 12: Chi-Square Tests112 Questions
Exam 13: Simple Linear Regression Analysis140 Questions
Exam 14: Multiple Regression and Model Building150 Questions
Exam 15: Process Improvement Using Control Charts117 Questions
Select questions type
In a statistics class,the following 10 scores were randomly selected: 74,73,77,77,71,68,65,77,67,66. What is the median?
(Multiple Choice)
4.7/5  (28)
(28)
The company financial officer was interested in the average cost of PCs that had been purchased in the past six months.She took a random sample of the price of 10 computers,with the following results. $3,250,$1,127,$2,995,$3,250,$3,445,$3,449,$1,482,$6,120,$3,009,$4,000
What is the IQR?
(Multiple Choice)
5.0/5 (29)
In a statistics class,10 scores were randomly selected,with the following results: 74,73,77,77,71,68,65,77,67,66
What is the 10th percentile?
(Multiple Choice)
4.8/5 (41)
Find the z-score for an IQ test score of 142 when the mean is 100 and the standard deviation is 15.
(Multiple Choice)
4.8/5 (39)
If there are 7 classes in a frequency distribution,then the fourth class will always contain the median.
(True/False)
4.7/5 (40)
A measurement located outside the upper limits of a box-and-whiskers display is ___________.
(Multiple Choice)
4.8/5 (37)
Researchers wish to study fuel consumption rates based on speed.The data from the test car at 10 speeds are below: 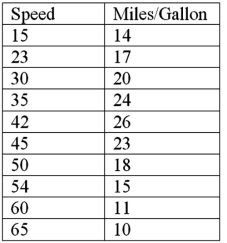 It can be shown that for these data:
  Calculate b1.
(Short Answer)
4.9/5 (39)
In a study of employee stock ownership plans,data were collected at seven companies on satisfaction with the plan and the amount of organization commitment. 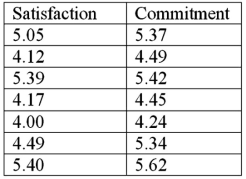 It can be shown that for these data:
  Calculate b1.
(Short Answer)
4.9/5 (40)
The measurement in a sample or a population that occurs most frequently is the ___________.
(Multiple Choice)
4.8/5 (28)
The average life of Canadian women is 73.75 years,and the standard deviation of the life expectancy of Canadian women is 6.5 years.Based on Chebyshev's Theorem,determine the upper and lower bounds on the average life expectancy of Canadian women such that at least 90 percent of the population is included.
(Multiple Choice)
4.9/5 (45)
The company financial officer was interested in the average cost of PCs that had been purchased in the past six months.She took a random sample of the price of 10 computers,with the following results. $3,250,$1,127,$2,995,$3,250,$3,445,$3,449,$1,482,$6,120,$3,009,$4,000
What is the third quartile?
(Multiple Choice)
4.9/5 (37)
In a study of the factors that affect success in economics,data were collected for 8 business students.Scores on a calculus placement test are given with economics final exam scores.The data are below: 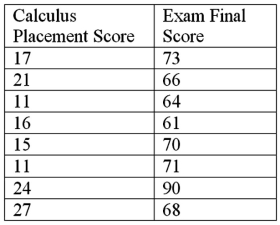 It can be shown that for these data:
  140.75.
Calculate b1.
140.75.
Calculate b1.
(Short Answer)
4.8/5 (38)
The pth percentile is a value such that (100 - p)percent of the measurements fall at or below the value.
(True/False)
4.8/5 (41)
A company CEO asked the marketing research department to find the average age of consumers who bought the most profitable product made by the company.From survey data gathered two years ago,the researchers found the following table.Calculate the average age to give to the CEO. 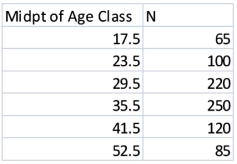
(Short Answer)
4.9/5 (34)
Personnel managers usually want to know where a job applicant ranked in his or her graduating class.With a grade point average of 3.83,Michelle Robinson graduated above the 93rd percentile of her graduating class.What is the percentile rank of a student whose GPA was the median GPA?
(Multiple Choice)
4.7/5 (48)
In a statistics class,the following 10 scores were randomly selected: 74,73,77,77,71,68,65,77,67,66. What is the mean?
(Multiple Choice)
4.8/5 (38)
A normal population has 99.73 percent of the population measurements within __________ standard deviations of the mean.
(Multiple Choice)
4.8/5 (40)
Quality control is an important issue at ACME Company,which manufactures light bulbs.To test the life-hours of their light bulbs,they randomly sampled nine light bulbs and measured how many hours they lasted (mean = 346.6). 378,361,350,375,200,391,375,368,321
What is the standard deviation?
(Multiple Choice)
4.9/5 (34)
Filters
- Essay(0)
- Multiple Choice(0)
- Short Answer(0)
- True False(0)
- Matching(0)