Exam 3: Descriptive Statistics: Numerical Methods
Exam 1: An Introduction to Business Statistics63 Questions
Exam 2: Descriptive Statistics: Tabular and Graphical Methods100 Questions
Exam 3: Descriptive Statistics: Numerical Methods141 Questions
Exam 4: Probability127 Questions
Exam 5: Discrete Random Variables150 Questions
Exam 6: Continuous Random Variables145 Questions
Exam 7: Sampling and Sampling Distributions131 Questions
Exam 8: Confidence Intervals149 Questions
Exam 9: Hypothesis Testing150 Questions
Exam 10: Statistical Inferences Based on Two Samples139 Questions
Exam 11: Experimental Design and Analysis of Variance98 Questions
Exam 12: Chi-Square Tests112 Questions
Exam 13: Simple Linear Regression Analysis140 Questions
Exam 14: Multiple Regression and Model Building150 Questions
Exam 15: Process Improvement Using Control Charts117 Questions
Select questions type
The local amusement park was interested in the average wait time at their most popular roller coaster at the peak park time (2 p.m. ).They selected 13 patrons and had them get in line between 2 and 3 p.m.Each was given a stopwatch to record the time they spent in line.The times recorded were as follows (in minutes;mean = 114.15): 118,124,108,116,99,120,148,118,119,121,45,130,118.
What is the range?
(Multiple Choice)
4.8/5  (31)
(31)
A measure of the strength of the linear relationship between x and y that is dependent on the units in which x and y are measured.
(Multiple Choice)
4.9/5 (40)
Find the z-score for an IQ test score of 92 when the mean is 100 and the standard deviation is 15.
(Multiple Choice)
4.7/5 (31)
The local amusement park was interested in the average wait time at their most popular roller coaster at the peak park time (2 p.m. ).They selected 13 patrons and had them get in line between 2 and 3 p.m.Each was given a stopwatch to record the time they spent in line.The times recorded were as follows (in minutes). 118,124,108,116,99,120,148,118,119,121,45,130,118
What is the 65th percentile?
(Multiple Choice)
4.8/5 (39)
The median is the measure of central tendency that divides a population or sample into four equal parts.
(True/False)
4.8/5 (30)
Using grouped data of 14 classes with a sample mean of 51 and a sample variance of 6.42,calculate the group sampled standard deviation.
(Short Answer)
4.9/5 (35)
The following frequency table summarizes the ages of 60 shoppers at the local grocery store. 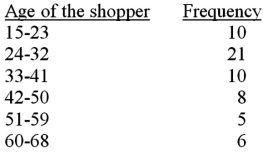 The sample mean for the above frequency table is calculated as 36.25.Calculate the approximate sample standard deviation for this data set.
(Multiple Choice)
4.8/5 (32)
In a statistics class,10 scores were randomly selected with the following results: 74,73,77,77,71,68,65,77,67,66
What is the first quartile?
(Multiple Choice)
4.9/5 (32)
As the coefficient of variation _______________,risk ______________.
(Multiple Choice)
5.0/5 (28)
The average of the squared deviations of the individual population measurement from the population mean is the ___________.
(Multiple Choice)
4.8/5 (40)
The weights that are used in calculating a weighted mean will vary depending on the situation.
(True/False)
5.0/5 (26)
Researchers wish to study fuel consumption rates based on speed.The data from the test car at 10 speeds are below. 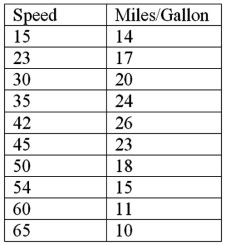 It can be shown that for these data:
  Calculate the sample correlation coefficient.
(Multiple Choice)
4.8/5 (34)
Suppose that annual sales for a company were $3.6 million at the beginning of a three-year period and at the end had increased to $6.1 million.Find the geometric growth rate of sales.
(Short Answer)
4.9/5 (36)
In a statistics class,10 scores were randomly selected with the following results: 74,73,77,77,71,68,65,77,67,66
What is the third quartile?
(Multiple Choice)
4.9/5 (36)
In a study of the factors that affect success in economics,data were collected for 8 business students.Scores on a calculus placement test are given with economics final exam scores.The data are below: 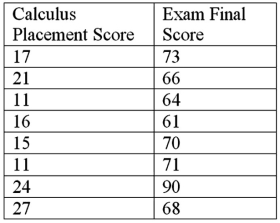 It can be shown that for these data:
  140.75. Calculate the sample covariance.
(Multiple Choice)
4.8/5 (39)
An initial investment of $10,000 is observed over 3 years with a geometric mean return at the end of year 3 of 0.512.Determine the value of the investment after 3 years.
(Short Answer)
4.7/5 (25)
Quality control is an important issue at ACME Company,which manufactures light bulbs.To test the life-hours of their light bulbs,they randomly sampled nine light bulbs and measured how many hours they lasted: 378,361,350,375,200,391,375,368,321. What is the median?
(Multiple Choice)
4.9/5 (34)
If a population distribution is skewed to the right,then,given a random sample from that population,one would expect that the ____________.
(Multiple Choice)
4.9/5 (30)
In the least squares line,___________ is defined as rise/run.
(Multiple Choice)
4.8/5 (32)
Filters
- Essay(0)
- Multiple Choice(0)
- Short Answer(0)
- True False(0)
- Matching(0)