Exam 6: Exponential and Logarithmic Functions
Exam 1: Algebraic Concepts308 Questions
Exam 2: Linear Equations and Functions243 Questions
Exam 3: Quadratic and Other Special Functions113 Questions
Exam 4: Matrices227 Questions
Exam 5: Inequalities and Linear Programming120 Questions
Exam 6: Exponential and Logarithmic Functions108 Questions
Exam 7: Mathematics of Finance131 Questions
Exam 8: Introduction to Probability178 Questions
Exam 9: Further Topics in Probability; Data Description114 Questions
Exam 10: Derivatives248 Questions
Exam 11: Applications of Derivatives172 Questions
Exam 12: Derivatives Continued139 Questions
Exam 13: Indefinite Integrals120 Questions
Exam 14: Definite Integrals: Techniques of Integration185 Questions
Exam 15: Functions of Two or More Variables119 Questions
Select questions type
Write the expression as the sum or difference of two logarithmic functions containing no exponents. 
(Multiple Choice)
5.0/5  (37)
(37)
Use a calculator to determine whether expression (a) is equivalent to expression (b). 
(Multiple Choice)
4.9/5 (28)
Use the formula 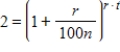 to find the doubling time t, in years, for an investment at r% compounded n times per year. Suppose you make an investment of $900 at interest rate 9% compounded quarterly. How long will it take for your investment to double? Round your answer to two decimal places.
(Multiple Choice)
4.7/5 (33)
Solve for x by writing the equation in exponential form. 
(Multiple Choice)
4.7/5 (36)
Use the properties of logarithms to write the expression as a single logarithm. 
(Multiple Choice)
4.8/5 (36)
The monthly sales S for a product is given by 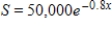 , where x is the number of months that have passed since the end of a promotional campaign. How many months after the end of the campaign will sales drop below 6,000, if no new campaign is initiated? Round to two decimal places.
(Multiple Choice)
4.8/5 (39)
Use a calculator to evaluate the expression. Round your answer to two decimal places, if necessary. 
(Multiple Choice)
4.8/5 (39)
If $4,000 is invested at an annual rate of 8% compounded continuously, the future value S at any time t (in years) is given by  . How long does it take for the investment to double? Round your answer to one decimal place.
(Multiple Choice)
4.7/5 (37)
Find an equivalent expression for the given logarithm using the change-of-base formula. 
(Multiple Choice)
4.8/5 (37)
On a college campus of 10,000 students, a single student returned to campus infected by a disease. The spread of the disease through the student body is given by 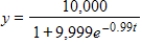 , where y is the total number infected at time t (in days). The school will shut down if 50% of the students are ill. What value of t corresponds to this percentage?
(Multiple Choice)
4.9/5 (28)
Between the years 1960 and 2002, the percent of women in the work force is given by 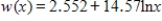 , where x is the number of years past 1950 (Source: U.S. Bureau of Labor Statistics). Graph this function with a graphing utility and use the graph drawn to estimate the year in which the percent reached 60. Round your answer to the nearest year.
(Multiple Choice)
4.8/5 (41)
Use a calculator to evaluate the expression. Round your answer to six decimal places. 
(Multiple Choice)
4.9/5 (31)
Use the properties of logarithms to write the expression as a single logarithm. 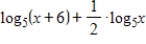
(Multiple Choice)
4.8/5 (37)
Use properties of logarithms or a definition to simplify the expression.
If  find
find  .
.
(Multiple Choice)
4.8/5 (42)
The following table gives the average number of students per computer in public schools for the school years that ended in 1985 through 2002. Find an exponential model for these data. How many students per computer in public schools does this model predict for 2005? Round your answer to two decimal places. 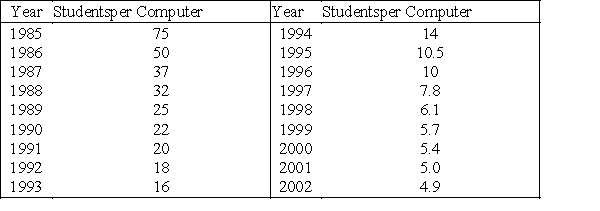
Source: Quality Education Data, Inc., Denver, Colorado
Source: Quality Education Data, Inc., Denver, Colorado

(Multiple Choice)
4.8/5 (35)
Use properties of logarithms or a definition to simplify the expression.
If  , find
  .
.
(Multiple Choice)
4.9/5 (30)
Filters
- Essay(0)
- Multiple Choice(0)
- Short Answer(0)
- True False(0)
- Matching(0)