Exam 6: Exponential and Logarithmic Functions
Exam 1: Algebraic Concepts308 Questions
Exam 2: Linear Equations and Functions243 Questions
Exam 3: Quadratic and Other Special Functions113 Questions
Exam 4: Matrices227 Questions
Exam 5: Inequalities and Linear Programming120 Questions
Exam 6: Exponential and Logarithmic Functions108 Questions
Exam 7: Mathematics of Finance131 Questions
Exam 8: Introduction to Probability178 Questions
Exam 9: Further Topics in Probability; Data Description114 Questions
Exam 10: Derivatives248 Questions
Exam 11: Applications of Derivatives172 Questions
Exam 12: Derivatives Continued139 Questions
Exam 13: Indefinite Integrals120 Questions
Exam 14: Definite Integrals: Techniques of Integration185 Questions
Exam 15: Functions of Two or More Variables119 Questions
Select questions type
If the total cost (in dollars) for x units of a product is given by 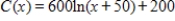 , what is the total cost of producing 180 units? Round your answer to the nearest cent.
(Multiple Choice)
4.9/5  (38)
(38)
Write the expression as the sum or difference of two logarithmic functions containing no exponents. 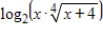
(Multiple Choice)
4.9/5 (30)
Let  . Use a graphing utility to graph the functions
  and
and  where
where  . Identify the graphs of
  and
and  below.
(Multiple Choice)
4.9/5 (34)
Use properties of logarithms or a definition to simplify the expression. Check the result with a change-of-base formula and a calculator. Round your answer two decimal places. 
(Multiple Choice)
4.8/5 (30)
The following table gives the average number of students per computer in public schools for the school years that ended in 1985 through 2002. Let x be the number of years past 1980. Find an exponential model for these data. Round your answer to three decimal places. 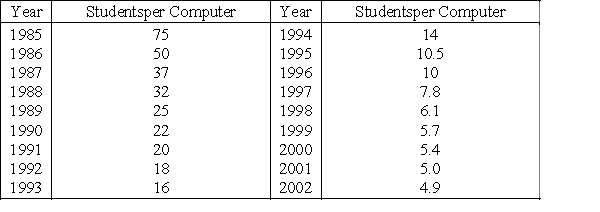 Source: Quality Education Data, Inc., Denver, Colorado
(Multiple Choice)
4.7/5 (38)
Use the following information. Chemists use the pH (hydrogen potential) of a solution to measure its acidity or basicity. The pH is given by the formula 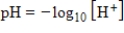 , where
  is the concentration of hydrogen ions in moles per liter. What value of
  is associated with pH level 13?
(Multiple Choice)
4.9/5 (28)
Let 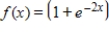 . Using a graphing utility, graph
 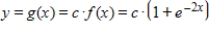 for
for  and
and  . What effect does c have on the graphs?
(Multiple Choice)
4.9/5 (36)
Between the years 1960 and 2002, the percent of women in the work force is given by  , where x is the number of years past 1950 (Source: U.S. Bureau of Labor Statistics). What does this model estimate to be the percent of women in the work force in 2019? Round your answer to two decimal places.
(Multiple Choice)
4.9/5 (35)
Evaluate the logarithm by using properties of logarithms and the following facts. Round your answer to two decimal places. 

(Multiple Choice)
4.9/5 (40)
Pollution levels in Lake Erie have been modeled by the equation 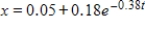 , where x is the volume of pollutants (in cubic kilometers) and t is the time (in years) (Adapted from R. H. Rainey, Science 155 (1967), 1242-1243). Find the initial pollution level; that is, find x when
  .
.
(Multiple Choice)
4.8/5 (34)
Use a change-of-base formula to evaluate  with a calculator or other technology. Round your answer to four decimal places.
(Multiple Choice)
4.7/5 (33)
Evaluate the logarithm by using properties of logarithms and the following fact. Round your answer two decimal places. 

(Multiple Choice)
4.8/5 (29)
The president of a company predicts that sales N will increase after she assumes office and that the number of monthly sales will follow the curve given by 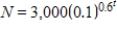 , where t represents time in months since she assumed office. What will be the sales after 9 months? Round your answer to the nearest month.
(Multiple Choice)
4.7/5 (25)
Solve the logarithmic equation 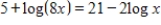 . Round your answer to three decimal places.
(Multiple Choice)
4.8/5 (27)
If $7,000 is invested at an annual rate of 11.5% compounded continuously, the future value S at any time t (in years) is given by 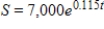 . What is the amount after 12 months? Round your answer to the nearest cent.
(Multiple Choice)
4.8/5 (36)
Use properties of logarithms or a definition to simplify the expression.
If  , find
  .
.
(Multiple Choice)
4.7/5 (33)
Use a calculator to evaluate the expression. Round your answer to two decimal places. 
(Multiple Choice)
4.9/5 (36)
The population y of a certain country was 100,000 in 1990 and 149,182 in 2000. Assume the formula  applies to the growth of the country's population. Estimate the population of the country in 2005. Round your answer to the nearest human.
(Multiple Choice)
4.8/5 (44)
Filters
- Essay(0)
- Multiple Choice(0)
- Short Answer(0)
- True False(0)
- Matching(0)