Exam 10: Introduction to the Derivative
Exam 1: Functions and Applications159 Questions
Exam 2: Nonlinear Functions and Models92 Questions
Exam 3: The Mathematics of Finance137 Questions
Exam 4: Systems of Linear Equations and Matrices111 Questions
Exam 5: Matrix Algebra and Applications174 Questions
Exam 6: Linear Programming161 Questions
Exam 7: Sets and Counting154 Questions
Exam 8: Probability257 Questions
Exam 9: Random Variables and Statistics178 Questions
Exam 10: Introduction to the Derivative139 Questions
Exam 11: Techniques of Differentiation104 Questions
Exam 12: Applications of the Derivative88 Questions
Exam 13: The Integral66 Questions
Exam 14: Further Integration Techniques and Applications of the Integral118 Questions
Exam 15: Functions of Several Variables137 Questions
Exam 16: Trigonometric Models67 Questions
Select questions type
Calculate the average rate of change of the given function over the interval . 0 1 2 3 f(x) 5 1 1 -13
Free
(Short Answer)
5.0/5  (26)
(26)
Correct Answer: Verified
-7
Use a graph to determine whether the given function is continuous on its domain. If it is not continuous on its domain, list the points of discontinuity.
Free
(Multiple Choice)
4.8/5 (33)
Correct Answer:Verified
D
If is the Dow Jones Average at time t and , is it possible that the Dow will fluctuate indefinitely into the future
Free
(Multiple Choice)
4.7/5 (34)
Correct Answer:Verified
A
The chart shows the total annual support for the arts in the U.S. by federal, state, and local government in 1995-2003 as a function of time in years ( represents 1995) together with the regression line. ![The chart shows the total annual support for the arts in the U.S. by federal, state, and local government in 1995-2003 as a function of time in years ( t = 0 represents 1995) together with the regression line. Over the period [ 0,4 ] the average rate of change of government funding for the arts was _____ the rate predicted by the regression line.](https://storage.examlex.com/TB6226/11eb0df5_e6c8_0a47_9431_998e43179bd3_TB6226_00.jpg) Over the period the average rate of change of government funding for the arts was _____ the rate predicted by the regression line.
Over the period the average rate of change of government funding for the arts was _____ the rate predicted by the regression line.
(Multiple Choice)
4.7/5 (37)
The function represents the value of the U.S. dollar in Indian rupees as a function of the time t in days. Find the average rates of change of over the time intervals , where t is as indicated and , , , and days. Hence, estimate (using ) the instantaneous rate of change of at time .
Select your answer rounded to the nearest whole number.
(Multiple Choice)
4.8/5 (34)
The function given below gives the cost to manufacture x items. Estimate (using ) the instantaneous rate of change of the cost at the production level .
Enter your answer as a number without the units rounded to the nearest tenth.
(Short Answer)
4.9/5 (33)
Calculate the average rate of change of the given function over the interval .
(Multiple Choice)
4.8/5 (42)
For the slope 2.2, determine at which of the labeled points on the graph the tangent line has that slope. 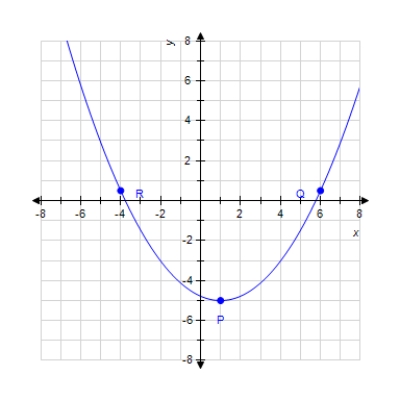
(Multiple Choice)
4.8/5 (31)
Filters
- Essay(0)
- Multiple Choice(0)
- Short Answer(0)
- True False(0)
- Matching(0)