Exam 8: Time Series Analysis and Forecasting
Exam 1: Introduction49 Questions
Exam 2: Descriptive Statistics84 Questions
Exam 3: Data Visualization69 Questions
Exam 4: Descriptive Data Mining56 Questions
Exam 5: Probability: an Introduction to Modeling Uncertainty62 Questions
Exam 6: Statistical Inference62 Questions
Exam 7: Linear Regression71 Questions
Exam 8: Time Series Analysis and Forecasting58 Questions
Exam 9: Predictive Data Mining40 Questions
Exam 10: Spreadsheet Models64 Questions
Exam 11: Linear Optimization Models58 Questions
Exam 12: Integer Linear Optimization Models56 Questions
Exam 13: Nonlinear Optimization Models55 Questions
Exam 14: Monte Carlo Simulation59 Questions
Exam 15: Decision Analysis58 Questions
Select questions type
The monthly market shares of General Electric Company for 12 consecutive months follow. Construct a time series plot. What type of pattern exists in the data?
Month Market Shares 1 23.39 2 23.56 3 23.02 4 23.03 5 23.60 6 23.37 7 23.21 8 23.40 9 23.31 10 23.94 11 23.39 12 23.50
(Essay)
4.9/5  (23)
(23)
Consider the following time series data. Year Value 1 234 2 287 3 255 4 310 5 298 6 250 7 456 8 412 9 525 10 436 Using the naïve method (most recent value) as the forecast for the next year, compute the following measures of forecast accuracy.
a. Mean absolute error
b. Mean squared error
c. Mean absolute percentage error
d. What is the forecast for year 11?
(Essay)
4.7/5 (33)
Consider the following time series data. Year Value 1 234 2 287 3 255 4 310 5 298 6 250 7 302 8 267 9 225 10 336
a. Construct a time series plot. What type of pattern exists in the data?
b. Develop a three-year moving average for this time series. Compute MSE and a forecast for the year 11.
(Essay)
4.9/5 (35)
The monthly sales (in hundreds of dollars) of a company are listed below. Month Sales () January 12,354 February 13,657 March 14,536 April 13,478 May 16,590 June 19,790 July 17,987 August 18,657 September 19,765 October 18,678 November 20,678 December 23,675
a. Construct a time series plot. What type of pattern exists in the data?
b. Use simple linear regression analysis to find the parameters for the line that minimizes MSE for this time series.
c. What is the sales forecast (in hundreds of dollars) for next month?
(Essay)
4.7/5 (41)
Using a large value for order k in the moving averages method is effective in
(Multiple Choice)
4.8/5 (40)
The following data shows the quarterly profit (in thousands of dollars) made by a particular company in the past 3 years. Year Quarter Profit ( \1 000s) 1 1 45 1 2 51 1 3 72 1 4 50 2 1 49 2 2 45 2 3 79 2 4 54 3 1 42 3 2 58 3 3 70 3 4 56
a. Use α = 0.3 to compute the exponential smoothing values for the time series. Compute MSE and the forecast of profit (in $1000s) for the next quarter.
b. Compare the three-period moving average forecast with the exponential smoothing forecast using α = 0.3. Which appears to provide the better forecast based on MSE?
(Essay)
5.0/5 (41)
Which of the following is not present in a time series?
(Multiple Choice)
4.8/5 (38)
A positive forecast error indicates that the forecasting method ________ the dependent variable.
(Multiple Choice)
4.9/5 (35)
A time series plot of a period of time (in years) verses sales (in thousands of dollars) is shown below Which of the following data patterns best describes the scenario shown? 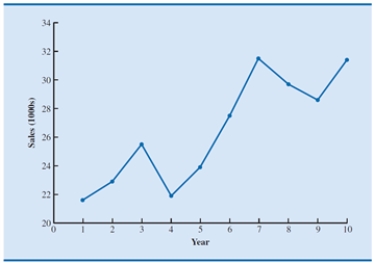
(Multiple Choice)
4.8/5 (43)
Which of the following is not true of a stationary time series?
(Multiple Choice)
5.0/5 (38)
Which of the following is true of the exponential smoothing coefficient?
(Multiple Choice)
4.9/5 (39)
The following times series shows the demand for a particular product over the past 10 months. Month Value 1 324 2 311 3 303 4 314 5 323 6 313 7 302 8 315 9 312 10 326
a. Use α = 0.2 to compute the exponential smoothing values for the time series. Compute MSE and a forecast for month 11.
b. Compare the three-month moving average forecast with the exponential smoothing forecast using α = 0.2. Which appears to provide the better forecast based on MSE?
(Essay)
4.7/5 (33)
The value of an independent variable from the prior period is referred to as a
(Multiple Choice)
4.8/5 (40)
______________________ uses a weighted average of past time series values as the forecast.
(Multiple Choice)
4.9/5 (45)
A time series that shows a recurring pattern over one year or less is said to follow a
(Multiple Choice)
4.8/5 (36)
Filters
- Essay(0)
- Multiple Choice(0)
- Short Answer(0)
- True False(0)
- Matching(0)