Exam 3: Descriptive Statistics: Numerical Measures
Exam 1: Data and Statistics84 Questions
Exam 2: Descriptive Statistics: Tabular and Graphical Displays67 Questions
Exam 3: Descriptive Statistics: Numerical Measures127 Questions
Exam 4: Introduction to Probability99 Questions
Exam 5: Discrete Probability Distributions86 Questions
Exam 6: Continuous Probability Distributions120 Questions
Exam 7: Sampling and Sampling Distributions117 Questions
Exam 8: Interval Estimation144 Questions
Exam 9: Hypothesis Tests129 Questions
Exam 10: Inference About Means and Proportions With Two Populations85 Questions
Exam 11: Inferences About Population Variances85 Questions
Exam 12: Comparing Multiple Proportions, Tests of Independence and Goodness of Fit59 Questions
Exam 13: Experimental Design and Analysis of Variance80 Questions
Exam 14: Simple Linear Regression131 Questions
Exam 15: Multiple Regression103 Questions
Select questions type
The following frequency distribution shows the GMAT scores of a sample of MBA students. 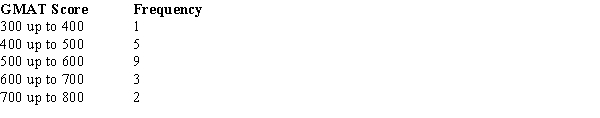 For the above data, compute the mean GMAT score.
(Short Answer)
4.7/5  (32)
(32)
A numerical value used as a summary measure for a sample is known as a sample
(Multiple Choice)
4.9/5 (40)
The average wage of Tennessee cashiers is $14 per hour with a standard deviation of $4.20.In Georgia, the average wage of cashiers is $16 with a standard deviation of $4.40.In which state do the wages of cashiers appear to be more dispersed?
(Essay)
4.8/5 (34)
The value of the sum of the deviations from the mean, i.e.,  must always be
(Multiple Choice)
4.8/5 (41)
A numerical measure of linear association between two variables is the
(Multiple Choice)
4.8/5 (31)
The value which has half of the observations above it and half the observations below it is called the
(Multiple Choice)
4.9/5 (39)
Generally, which one of the following is the least appropriate measure of central tendency for a data set that contains outliers?
(Multiple Choice)
4.7/5 (30)
The coefficient of variation indicates how large the standard deviation is relative to the
(Multiple Choice)
4.9/5 (28)
In computing descriptive statistics for grouped data, the data values in each class are approximated using the
(Multiple Choice)
4.8/5 (43)
The variance of a sample was reported to be 144.The report indicated that  = 7200.What is the sample size?
(Multiple Choice)
4.9/5 (46)
When n - 1 is used in the denominator to compute variance, the data set
(Multiple Choice)
4.7/5 (38)
The variance of a sample of 100 observations equals 64.The standard deviation of the sample equals
(Multiple Choice)
4.8/5 (44)
Filters
- Essay(0)
- Multiple Choice(0)
- Short Answer(0)
- True False(0)
- Matching(0)