Exam 3: Descriptive Statistics: Numerical Measures
Exam 1: Data and Statistics84 Questions
Exam 2: Descriptive Statistics: Tabular and Graphical Displays67 Questions
Exam 3: Descriptive Statistics: Numerical Measures127 Questions
Exam 4: Introduction to Probability99 Questions
Exam 5: Discrete Probability Distributions86 Questions
Exam 6: Continuous Probability Distributions120 Questions
Exam 7: Sampling and Sampling Distributions117 Questions
Exam 8: Interval Estimation144 Questions
Exam 9: Hypothesis Tests129 Questions
Exam 10: Inference About Means and Proportions With Two Populations85 Questions
Exam 11: Inferences About Population Variances85 Questions
Exam 12: Comparing Multiple Proportions, Tests of Independence and Goodness of Fit59 Questions
Exam 13: Experimental Design and Analysis of Variance80 Questions
Exam 14: Simple Linear Regression131 Questions
Exam 15: Multiple Regression103 Questions
Select questions type
A researcher has collected the following sample data.The mean of the sample is 5.  The standard deviation is
(Multiple Choice)
4.9/5  (44)
(44)
Which of the following provides a measure of central tendency for the data?
(Multiple Choice)
4.8/5 (36)
In the last month, Nancy purchased gasoline from four different gas stations.The following table shows the price per gallon and the gallons of gasoline that she purchased. 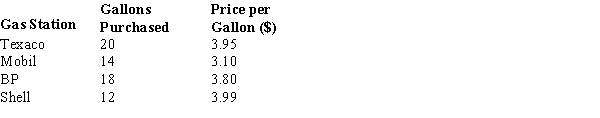 Determine the average price per gallon that Nancy paid for the gasoline.
(Short Answer)
4.8/5 (38)
The price of a selected stock over a five day period is shown below.
47, 45, 43, 47, 46
Using the above data, compute the mean, the median, and the mode.
(Short Answer)
4.9/5 (37)
Filters
- Essay(0)
- Multiple Choice(0)
- Short Answer(0)
- True False(0)
- Matching(0)