Exam 3: Descriptive Statistics: Numerical Measures
Exam 1: Data and Statistics84 Questions
Exam 2: Descriptive Statistics: Tabular and Graphical Displays67 Questions
Exam 3: Descriptive Statistics: Numerical Measures127 Questions
Exam 4: Introduction to Probability99 Questions
Exam 5: Discrete Probability Distributions86 Questions
Exam 6: Continuous Probability Distributions120 Questions
Exam 7: Sampling and Sampling Distributions117 Questions
Exam 8: Interval Estimation144 Questions
Exam 9: Hypothesis Tests129 Questions
Exam 10: Inference About Means and Proportions With Two Populations85 Questions
Exam 11: Inferences About Population Variances85 Questions
Exam 12: Comparing Multiple Proportions, Tests of Independence and Goodness of Fit59 Questions
Exam 13: Experimental Design and Analysis of Variance80 Questions
Exam 14: Simple Linear Regression131 Questions
Exam 15: Multiple Regression103 Questions
Select questions type
The percentage of data values that must be within one, two, and three standard deviations of the mean for data having a bell-shaped distribution can be determined using
(Multiple Choice)
4.7/5  (38)
(38)
In the fall semester of 2009, the average Graduate Management Admission Test (GMAT) of the students at UTC was 500 with a standard deviation of 80.In the fall of 2010, the average GMAT was 560 with a standard deviation of 84.Which year's GMAT scores show a more dispersed distribution?
(Essay)
4.7/5 (33)
The measure of variability easiest to compute, but seldom used as the only measure, is the
(Multiple Choice)
4.9/5 (37)
Consider a sample with the following data values.
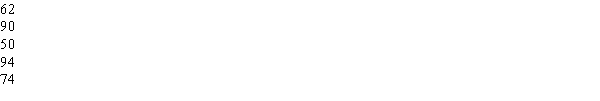
Compute the Z scores for the above five observations.
Compute the Z scores for the above five observations.
(Essay)
4.8/5 (37)
The last semester grades of Nancy, a freshman at a local college are shown below.

The local university uses a 4 point grading system, i.e., A = 4, B = 3, C = 2, D = 1, F = 0.Compute Nancy's semester grade point average.
The local university uses a 4 point grading system, i.e., A = 4, B = 3, C = 2, D = 1, F = 0.Compute Nancy's semester grade point average.
(Short Answer)
4.8/5 (27)
A mean computed in such a way that each data value is given a weight reflecting its importance is referred to as a
(Multiple Choice)
4.7/5 (43)
The measure of location which is the most likely to be influenced by extreme values in the data set is the
(Multiple Choice)
4.9/5 (32)
The measure of variability that is influenced most by extreme values is the
(Multiple Choice)
4.8/5 (32)
The standard deviation of a sample was reported to be 20.The report indicated that  = 7200.What is the sample size?
(Multiple Choice)
4.9/5 (37)
If a data set has an even number of observations, the median
(Multiple Choice)
4.7/5 (38)
The following is the frequency distribution for the speed of a sample of automobiles traveling on an interstate highway. 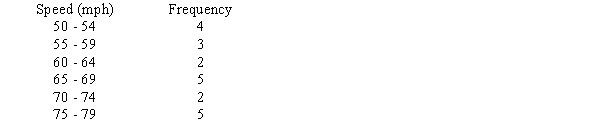 The standard deviation is
(Multiple Choice)
4.9/5 (41)
A researcher has collected the following sample data.  The 75th percentile is
(Multiple Choice)
4.9/5 (39)
The variance of a sample of 144 observations equals 576.The standard deviation of the sample equals
(Multiple Choice)
4.8/5 (45)
Filters
- Essay(0)
- Multiple Choice(0)
- Short Answer(0)
- True False(0)
- Matching(0)