Exam 12: Comparing Multiple Proportions, Tests of Independence and Goodness of Fit
Exam 1: Data and Statistics84 Questions
Exam 2: Descriptive Statistics: Tabular and Graphical Displays67 Questions
Exam 3: Descriptive Statistics: Numerical Measures118 Questions
Exam 4: Introduction to Probability94 Questions
Exam 5: Discrete Probability Distributions84 Questions
Exam 6: Continuous Probability Distributions121 Questions
Exam 7: Sampling and Sampling Distributions116 Questions
Exam 8: Interval Estimation90 Questions
Exam 9: Hypothesis Tests95 Questions
Exam 10: Inference About Means and Proportions With Two Populations63 Questions
Exam 11: Inferences About Population Variances66 Questions
Exam 12: Comparing Multiple Proportions, Tests of Independence and Goodness of Fit59 Questions
Exam 13: Experimental Design and Analysis of Variance76 Questions
Exam 14: Simple Linear Regression132 Questions
Exam 15: Multiple Regression103 Questions
Exam 16: Regression Analysis: Model Building41 Questions
Exam 17: Time Series Analysis and Forecasting51 Questions
Exam 18: Nonparametric Methods58 Questions
Exam 19: Decision Analysis48 Questions
Exam 20: Index Numbers39 Questions
Exam 21: Statistical Methods for Quality Control60 Questions
Exam 22: Sample Survey48 Questions
Select questions type
The test statistic for goodness of fit has a chi-square distribution with k - 1 degrees of freedom provided that the expected frequencies for all categories are
(Multiple Choice)
4.7/5  (41)
(41)
The number of degrees of freedom associated with the chi-square distribution in a test of independence is number of _____ minus 1.
(Multiple Choice)
4.8/5 (39)
The degrees of freedom for a data table with 10 rows and 10 columns is
(Multiple Choice)
4.9/5 (39)
You want to test whether or not the following sample of 30 observations follows a normal distribution. The mean of the sample equals 11.83 and the standard deviation equals 4.53.  The calculated value for the test statistic equals
(Multiple Choice)
4.9/5 (33)
The sampling distribution for a goodness of fit test is the _____ distribution.
(Multiple Choice)
4.7/5 (37)
The test for goodness of fit, test of independence, and test of multiple proportions are designed for use with _____ data.
(Multiple Choice)
4.8/5 (38)
The owner of a car wash wants to see if the arrival rate of cars follows a Poisson distribution. In order to test the assumption of a Poisson distribution, a random sample of 150 ten-minute intervals was taken. You are given the following observed frequencies:  The p-value is
(Multiple Choice)
4.7/5 (39)
Last school year, the student body of a local university consisted of 30% freshmen, 24% sophomores, 26% juniors, and 20% seniors. A sample of 400 students taken from this year's student body showed the following number of students in each classification.  We are interested in determining whether or not there has been a significant change in the classifications between the last school year and this school year. At a .01 level of significance, the null hypothesis
(Multiple Choice)
4.8/5 (29)
In the past, 35% of the students at ABC University were in the Business College, 35% of the students were in the Liberal Arts College, and 30% of the students were in the Education College. To see whether or not the proportions have changed, a sample of 300 students from the university was taken. Ninety of the sample students are in the Business College, 120 are in the Liberal Arts College, and 90 are in the Education College. Using α = .05, the conclusion of the test is that the
(Multiple Choice)
4.8/5 (28)
You want to test whether or not the following sample of 30 observations follows a normal distribution. The mean of the sample equals 11.83 and the standard deviation equals 4.53. 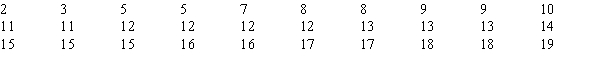 The expected frequency in the 3rd interval is
(Multiple Choice)
4.9/5 (32)
The following table shows the number of individuals in a sample of 300 who indicated they support the new tax proposal.  We are interested in determining whether or not the opinions of the individuals of the three groups are uniformly distributed. The calculated value for the test statistic equals
(Multiple Choice)
4.8/5 (35)
The properties of a multinomial experiment include all of the following except
(Multiple Choice)
4.8/5 (33)
When individuals in a sample of 150 were asked whether or not they supported capital punishment, the following information was obtained.  We are interested in determining whether or not the opinions of the individuals (as to Yes, No, and No Opinion) are uniformly distributed. The expected frequency for each group is
(Multiple Choice)
4.8/5 (34)
Last school year, the student body of a local university consisted of 30% freshmen, 24% sophomores, 26% juniors, and 20% seniors. A sample of 400 students taken from this year's student body showed the following number of students in each classification.  We are interested in determining whether or not there has been a significant change in the classifications between the last school year and this school year. The p-value is
(Multiple Choice)
4.9/5 (40)
The following table shows the number of individuals in a sample of 300 who indicated they support the new tax proposal.  We are interested in determining whether or not the opinions of the individuals of the three groups are uniformly distributed. The number of degrees of freedom associated with this problem is
(Multiple Choice)
5.0/5 (38)
A major automobile manufacturer claimed that the frequencies of repairs on all five models of its cars are the same. A sample of 200 repair services showed the following frequencies on the various makes of cars. 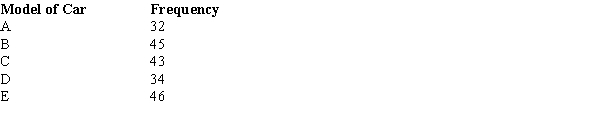
At α = .01, test the manufacturer's claim.
At α = .01, test the manufacturer's claim.
(Essay)
4.8/5 (27)
The owner of a car wash wants to see if the arrival rate of cars follows a Poisson distribution. In order to test the assumption of a Poisson distribution, a random sample of 150 ten-minute intervals was taken. You are given the following observed frequencies: 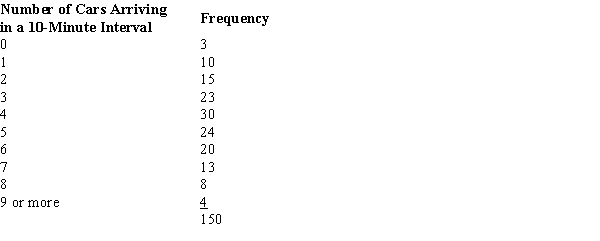 The calculated value for the test statistic equals
(Multiple Choice)
4.8/5 (35)
The degrees of freedom for a data table with 10 rows and 11 columns is
(Multiple Choice)
4.8/5 (33)
Two hundred fifty managers with degrees in business administration indicated their fields of concentration as shown below. 
At α = .01 using the p-value approach, test to determine if the position in management is independent of the major of concentration.
At α = .01 using the p-value approach, test to determine if the position in management is independent of the major of concentration.
(Essay)
4.8/5 (37)
Filters
- Essay(0)
- Multiple Choice(0)
- Short Answer(0)
- True False(0)
- Matching(0)