Exam 10: Inference About Means and Proportions With Two Populations
Exam 1: Data and Statistics84 Questions
Exam 2: Descriptive Statistics: Tabular and Graphical Displays67 Questions
Exam 3: Descriptive Statistics: Numerical Measures118 Questions
Exam 4: Introduction to Probability94 Questions
Exam 5: Discrete Probability Distributions84 Questions
Exam 6: Continuous Probability Distributions121 Questions
Exam 7: Sampling and Sampling Distributions116 Questions
Exam 8: Interval Estimation90 Questions
Exam 9: Hypothesis Tests95 Questions
Exam 10: Inference About Means and Proportions With Two Populations63 Questions
Exam 11: Inferences About Population Variances66 Questions
Exam 12: Comparing Multiple Proportions, Tests of Independence and Goodness of Fit59 Questions
Exam 13: Experimental Design and Analysis of Variance76 Questions
Exam 14: Simple Linear Regression132 Questions
Exam 15: Multiple Regression103 Questions
Exam 16: Regression Analysis: Model Building41 Questions
Exam 17: Time Series Analysis and Forecasting51 Questions
Exam 18: Nonparametric Methods58 Questions
Exam 19: Decision Analysis48 Questions
Exam 20: Index Numbers39 Questions
Exam 21: Statistical Methods for Quality Control60 Questions
Exam 22: Sample Survey48 Questions
Select questions type
The following information was obtained from independent random samples taken of two populations. Assume normally distributed populations with equal variances. 
The standard error of
The standard error of  -
-  is
is
(Multiple Choice)
4.9/5  (40)
(40)
The results of a recent poll on the preference of shoppers regarding two products are shown below.  The standard error of
  -
-  is
is
(Multiple Choice)
4.9/5 (41)
The management of a department store is interested in estimating the difference between the mean credit purchases of customers using the store's credit card versus those customers using a national major credit card. You are given the following information. 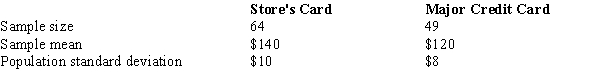 A 95% confidence interval estimate for the difference between the average purchases of all customers using the two different credit cards is
(Multiple Choice)
4.9/5 (32)
A statistics teacher wants to see if there is any difference in the abilities of students enrolled in statistics today and those enrolled five years ago. A sample of final examination scores from students enrolled today and from students enrolled five years ago was taken. You are given the following information. 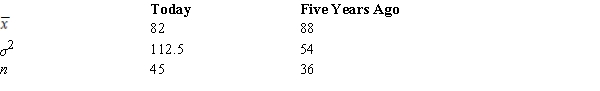 The p-value for the difference between the two population means is
(Multiple Choice)
4.8/5 (36)
A statistics teacher wants to see if there is any difference in the abilities of students enrolled in statistics today and those enrolled five years ago. A sample of final examination scores from students enrolled today and from students enrolled five years ago was taken. You are given the following information.  The standard error of
  -
-  is
is
(Multiple Choice)
4.8/5 (42)
Salary information regarding male and female employees of a large company is shown below. 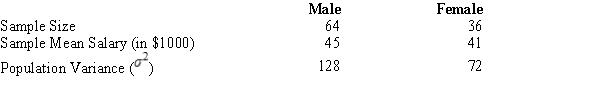 At 95% confidence, the margin of error is
(Multiple Choice)
4.8/5 (30)
A comparative study of organic and conventionally grown produce was checked for the presence of E. coli. Results are summarized below. Is there a significant difference in the proportion of E. coli in organic vs. conventionally grown produce? Test at α = .10. 
(Short Answer)
4.9/5 (35)
When each data value in one sample is matched with a corresponding data value in another sample, the samples are known as _____ samples.
(Multiple Choice)
4.8/5 (34)
The following information was obtained from matched samples taken from two populations. The daily production rates for a sample of workers before and after a training program are shown below. Assume the population of differences is normally distributed. 
Given that the null hypothesis to be tested is H0: μd = 0,
Given that the null hypothesis to be tested is H0: μd = 0,
(Multiple Choice)
4.9/5 (36)
To construct an interval estimate for the difference between the means of two populations when the standard deviations of the two populations are unknown and it can be assumed the two populations have equal variances, we must use a t distribution with (let n1 be the size of sample 1 and n2 the size of sample 2) _____ degrees of freedom.
(Multiple Choice)
4.7/5 (25)
The results of a recent poll on the preference of teenagers regarding the types of music they listen to are shown below.  The 95% confidence interval for the difference between the two population proportions is
(Multiple Choice)
4.9/5 (39)
Salary information regarding male and female employees of a large company is shown below.  The 95% confidence interval for the difference between the means of the two populations is
(Multiple Choice)
4.8/5 (36)
In order to determine whether or not there is a significant difference between the mean hourly wages paid by two companies (of the same industry), the following data have been accumulated. 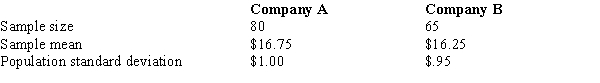 A point estimate for the difference between the two population means is
(Multiple Choice)
4.8/5 (31)
The following information was obtained from matched samples taken from two populations. The daily production rates for a sample of workers before and after a training program are shown below. Assume the population of differences is normally distributed. 
The point estimate for the difference between the means of the two populations is
The point estimate for the difference between the means of the two populations is
(Multiple Choice)
4.8/5 (27)
Salary information regarding male and female employees of a large company is shown below. 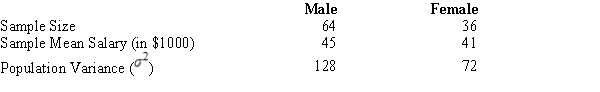 If you are interested in testing whether or not the population average salary of males is significantly greater than that of females at an α = .05, the test statistic is
(Multiple Choice)
4.9/5 (28)
Two major automobile manufacturers have produced compact cars with engines of the same size. We are interested in determining whether or not there is a significant difference in the mean MPG (miles per gallon) when testing for the fuel efficiency of these two brands of automobiles. A random sample of eight cars from each manufacturer is selected, and eight drivers are selected to drive each automobile for a specified distance. The following data (in miles per gallon) show the results of the test. Assume the population of differences is normally distributed.  The test statistic is
(Multiple Choice)
4.7/5 (40)
The management of a department store is interested in estimating the difference between the mean credit purchases of customers using the store's credit card versus those customers using a national major credit card. You are given the following information.  At 95% confidence, the margin of error is
(Multiple Choice)
4.8/5 (34)
An insurance company selected samples of clients under 18 years of age and over 18 and recorded the number of accidents they had in the previous year. The results are shown below.  We are interested in determining if the accident proportions differ between the two age groups. The p-value is
(Multiple Choice)
5.0/5 (38)
Filters
- Essay(0)
- Multiple Choice(0)
- Short Answer(0)
- True False(0)
- Matching(0)