Exam 10: Inference About Means and Proportions With Two Populations
Exam 1: Data and Statistics84 Questions
Exam 2: Descriptive Statistics: Tabular and Graphical Displays67 Questions
Exam 3: Descriptive Statistics: Numerical Measures118 Questions
Exam 4: Introduction to Probability94 Questions
Exam 5: Discrete Probability Distributions84 Questions
Exam 6: Continuous Probability Distributions121 Questions
Exam 7: Sampling and Sampling Distributions116 Questions
Exam 8: Interval Estimation90 Questions
Exam 9: Hypothesis Tests95 Questions
Exam 10: Inference About Means and Proportions With Two Populations63 Questions
Exam 11: Inferences About Population Variances66 Questions
Exam 12: Comparing Multiple Proportions, Tests of Independence and Goodness of Fit59 Questions
Exam 13: Experimental Design and Analysis of Variance76 Questions
Exam 14: Simple Linear Regression132 Questions
Exam 15: Multiple Regression103 Questions
Exam 16: Regression Analysis: Model Building41 Questions
Exam 17: Time Series Analysis and Forecasting51 Questions
Exam 18: Nonparametric Methods58 Questions
Exam 19: Decision Analysis48 Questions
Exam 20: Index Numbers39 Questions
Exam 21: Statistical Methods for Quality Control60 Questions
Exam 22: Sample Survey48 Questions
Select questions type
Salary information regarding male and female employees of a large company is shown below. 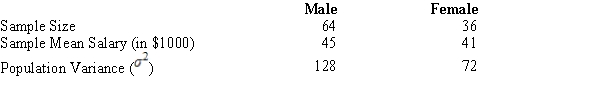 If you are interested in testing whether or not the population average salary of males is significantly greater than that of females, at α = .05, the conclusion is that the population
(Multiple Choice)
4.9/5  (40)
(40)
Two independent simple random samples are taken to test the difference between the means of two populations whose variances are not known, but are assumed to be equal. The sample sizes are n1 = 31 and n2 = 40. The correct distribution to use is the t distribution with _____ degrees of freedom.
(Multiple Choice)
4.8/5 (30)
An insurance company selected samples of clients under 18 years of age and over 18 and recorded the number of accidents they had in the previous year. The results are shown below. 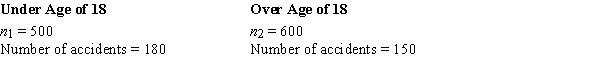 We are interested in determining if the accident proportions differ between the two age groups.
The pooled estimator of the population proportion is
We are interested in determining if the accident proportions differ between the two age groups.
The pooled estimator of the population proportion is
(Multiple Choice)
4.9/5 (43)
Filters
- Essay(0)
- Multiple Choice(0)
- Short Answer(0)
- True False(0)
- Matching(0)