Exam 4: Graphical Descriptive Techniques Numerical Data
Exam 1: What Is Statistics16 Questions
Exam 2: Types of Data, Data Collection and Sampling17 Questions
Exam 3: Graphical Descriptive Methods Nominal Data20 Questions
Exam 4: Graphical Descriptive Techniques Numerical Data64 Questions
Exam 5: Numerical Descriptive Measures150 Questions
Exam 6: Probability112 Questions
Exam 7: Random Variables and Discrete Probability Distributions55 Questions
Exam 8: Continuous Probability Distributions118 Questions
Exam 9: Statistical Inference: Introduction8 Questions
Exam 10: Sampling Distributions68 Questions
Exam 11: Estimation: Describing a Single Population132 Questions
Exam 12: Estimation: Comparing Two Populations23 Questions
Exam 13: Hypothesis Testing: Describing a Single Population130 Questions
Exam 14: Hypothesis Testing: Comparing Two Populations81 Questions
Exam 15: Inference About Population Variances47 Questions
Exam 16: Analysis of Variance125 Questions
Exam 17: Additional Tests for Nominal Data: Chi-Squared Tests116 Questions
Exam 18: Simple Linear Regression and Correlation219 Questions
Exam 19: Multiple Regression121 Questions
Exam 20: Model Building100 Questions
Exam 21: Nonparametric Techniques136 Questions
Exam 22: Statistical Inference: Conclusion106 Questions
Exam 23: Time-Series Analysis and Forecasting146 Questions
Exam 24: Index Numbers27 Questions
Exam 25: Decision Analysis51 Questions
Select questions type
Which of the following statements is false? A All calculations are permitted on numerical (quantitative) data B All calculations are permitted on nominal (categorical) data. C The most important aspect of ordinal data is the order of the data values. D The only permissible calculations on ordinal data are ones involving a ranking process.
(Short Answer)
4.8/5  (35)
(35)
Construct an ogive for the test grades for a university business statistics class, and estimate the proportion of grades that are between 80 and 90. 63 74 42 65 51 54 36 56 68 57 62 64 76 67 79 61 81 77 59 38 84 68 71 94 71 86 69 75 91 55 48 82 83 54 79 62 68 58 41 47
(Essay)
4.7/5 (32)
The ages of 25 salespersons in an organisation are given below. 47 21 37 53 28 40 30 32 34 26 34 24 24 35 45 38 35 28 43 45 30 45 31 41 56 Construct an ogive for the data, and estimate the proportion of salespersons that are:
a. less than 30 years of age.
b. more than 40 years of age.
c. between 40 and 50 years of age.
(Essay)
4.8/5 (29)
Construct a frequency distribution and relative frequency distribution for the test grades for a university business statistics class, data given in the following table. Use seven class intervals. 63 74 42 65 51 54 36 56 68 57 62 64 76 67 79 61 81 77 59 38 84 68 71 94 71 86 69 75 91 55 48 82 83 54 79 62 68 58 41 47
(Essay)
4.8/5 (39)
A histogram is said to be symmetric if, when we draw a vertical line down the center of the histogram, the two sides are mirror images of each other.
(True/False)
4.8/5 (32)
Which of the following is the most important and commonly used graphical presentation of numerical (quantitative) data? A Bar chart. B Histogram. C Fie chart. D Ogive.
(Short Answer)
4.8/5 (28)
A cumulative frequency distribution lists the proportion of observations that are within or below each of the classes.
(True/False)
4.8/5 (45)
Which of the following may be determined from the height of the bar in a relative frequency histogram? A The sample size. B The population size. C The proportion of observations that fall into that class. D The number of observations that fall into that class.
(Short Answer)
4.8/5 (42)
The table below shows the number of licensed hotels with at least 15 rooms in New South Wales from March 1998 to December 2009.
Mar-1998 175 Jun-1998 174 Sep-1998 174 Dec-1998 172 Mar-1999 177 Jun-1999 171 Sep-1999 176 Dec-1999 179 Mar-2000 181 Jun-2000 184 Sep-2000 191 Dec-2000 194 Mar-2001 198 Jun-2001 198 Sep-2001 199 Dec-2001 201 Mar-2002 198 Jun-2002 196 Sep-2002 195 Dec-2002 198 Mar-2003 199 Jun-2003 202 Sep-2003 201 Dec-2003 201 Mar-2004 199 Jun-2004 199 Sep-2004 198 Dec-2004 197 Mar-2005 199 Jun-2005 199 Sep-2005 198 Dec-2005 199 Mar-2006 202 Jun-2006 205 Sep-2006 203 Dec-2006 201 Mar-2007 202 Jun-2007 200 Sep-2007 202 Dec-2007 202 Mar-2008 201 Jun-2008 203 Sep-2008 204 Dec-2008 203 Mar-2009 203 Jun-2009 206 Sep-2009 203 Dec-2009 210 a. Plot the time series.
b. When did the number of licensed hotels with at least 15 rooms in New South Wales grow fastest?
(Essay)
4.9/5 (39)
Which of the following best describes the modal class? A The class with the largest number of observations. B The class with the smallest number of observations. C The class with the largest observation in the data set. D The class with the smallest observation in the data set.
(Short Answer)
4.8/5 (31)
The number of houses sold in a suburb in Sydney and the average monthly mortgage rates for 18 months randomly selected are shown in the following table. Mortgage rate (\%) Number of houses sold Mortgage rate (\%) Number of houses sold 7.5 90 9.5 68 9.0 72 6.5 97 7.0 89 8.0 79 10.5 62 9.0 75 10.0 58 10.5 53 9.5 70 9.5 73 8.5 74 11.0 50 10.0 65 7.5 82 11.0 51 8.5 70 a. Draw a scatter diagram with the number of houses sold on the vertical axis.
b. Describe the relationship between mortgage rate and number of houses sold.
(Essay)
4.8/5 (27)
Which of the following statements is true? A A histogram is created by drawing rectangles whose bases correspond to the class intervals, and the area of each rectangle equals the total number of observations in the sample. B A histogram can be used for only categorical variables. C A histogram is created by drawing rectangles whose bases correspond to the number of observations in each class. D A histogram is created by drawing rectangles whose bases correspond to the class intervals, and the area of each rectangle equals the number of observations in that class.
(Short Answer)
4.9/5 (24)
If we draw a straight line through the points in a scatter diagram and most of the points fall relatively close to the line, we say that there is a linear relationship between the two variables.
(True/False)
4.8/5 (33)
The number of faulty items returned to a manufacturer of electric goods in the last 15 years is as follows: Year No. of faulty items 1996 27 1997 35 1998 34 1999 39 2000 43 2001 42 2002 40 2003 41 2004 45 2005 47 2006 46 2007 50 2008 49 2009 52 2010 52 a. Construct a relative frequency bar chart for these data.
b. Construct a line chart.
(Essay)
4.9/5 (36)
Which of the following graphical display is can be used to describe relationship between two numerical (quantitative) variables? A A scatter diagram. B A histogram. C A bar chart. D A pie chart.
(Short Answer)
4.8/5 (32)
Which of the following statements best describes a stem-and-leaf display? A A stem-and-leaf display is similar to a histogram turned on its side. but the display holds the advantage of retaining the original observations. B A stem-and-leaf display holds the advantage of retaining the original observations. C A stem-and-leaf display is similar to a histogram turned on its side, but the display holds the advantage of retaining the original observations and holds the advantage of retaining the original observations. D A stem-and-leaf display may be used for nominal variables.
(Short Answer)
4.9/5 (28)
The bar chart below is of the colour of motor vehicles in a random sample. A student commented that the distribution was negatively skewed. Explain what is wrong with this statement.
Motor Vehicle Colour Relative Frequency Bar Chart 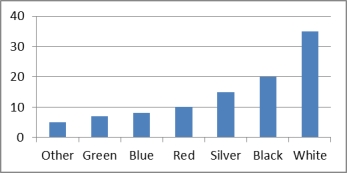
(Essay)
4.8/5 (35)
Frequency polygons are useful for obtaining a general idea of the shape of the distribution, because they are a bar chart.
(True/False)
4.9/5 (35)
Which of the following best describes the shape of the distribution of incomes of all employees in large company? A Positively skewed B Negatively skewed C Symmetric D Bell shaped.
(Short Answer)
4.9/5 (37)
When income increases, expenditure on imports tend to increase. Which of the following best describes this relationship? A A positive relationship. B A negative relationship. C An inverse relationship. D None of these choices are correct.
(Short Answer)
4.9/5 (30)
Filters
- Essay(0)
- Multiple Choice(0)
- Short Answer(0)
- True False(0)
- Matching(0)