Exam 14: Descriptive Statistics
Exam 1: Introduction to Scientific Research73 Questions
Exam 2: Research Approaches and Methods of Data Collection60 Questions
Exam 3: Problem Identification and Hypothesis Formation56 Questions
Exam 4: Ethics67 Questions
Exam 5: Measuring Variables and Sampling62 Questions
Exam 6: Research Validity61 Questions
Exam 7: Control Techniques in Experimental Research54 Questions
Exam 8: Experimental Research Design62 Questions
Exam 9: Procedure for Conducting an Experiment54 Questions
Exam 10: Quasi-Experimental Designs49 Questions
Exam 11: Single-Case Research Designs50 Questions
Exam 12: Survey Research63 Questions
Exam 13: Qualitative and Mixed Methods Research64 Questions
Exam 14: Descriptive Statistics66 Questions
Exam 15: Inferential Statistics59 Questions
Exam 16: Preparing the Research Report for Presentation or Publication62 Questions
Select questions type
For a data set with a mean = 10 and standard deviation = 2, what is the z score corresponding to a raw score of 7?
(Multiple Choice)
5.0/5  (33)
(33)
The relationship between number of friends and happiness is weaker in adulthood than in childhood. You make a scatter plot for children and a scatter plot for adults. In each scatter plot, you have SPSS insert the best fitting straight line. The cluster of dots for adults compared to that for children):
(Multiple Choice)
4.7/5 (43)
The mean, median, and mode are all considered to be measures of
(Multiple Choice)
4.8/5 (45)
Use the following frequency distribution to answer questions
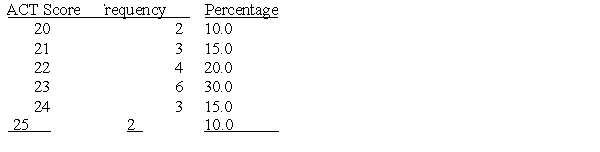 -Which of the following is the lowest score in the frequency distribution?
(Multiple Choice)
4.8/5 (40)
Use the following frequency distribution to answer questions
-Which of the following ACT scores is the mode for the data shown in the frequency distribution?
(Multiple Choice)
4.7/5 (41)
To display the relationship between two quantitative variables, one should use
(Multiple Choice)
4.8/5 (36)
In a histogram, frequencies are presented on the____ and the score variable is presented on the _____.
(Multiple Choice)
4.9/5 (39)
How does multiple regression differ from simple regression?
(Multiple Choice)
4.8/5 (40)
________is the exact average deviation of data values from the mean in squared units, and _____________is the approximate average deviation of data values from the mean in regular units.
(Multiple Choice)
4.8/5 (36)
Use the following frequency distribution to answer questions
-What is the most frequently occurring score in the frequency distribution?
(Multiple Choice)
4.8/5 (38)
What is Σ X for the following group of scores? 1, 2, 3, 4, 5
(Multiple Choice)
4.8/5 (36)
What position in a distribution of numbers corresponds to a z score of z = -2.00?
(Multiple Choice)
4.9/5 (32)
What kind of graph is used to display frequencies as bars without spaces between them?
(Multiple Choice)
4.9/5 (50)
A _________is a systematic arrangement of data values in which the unique data values are rank ordered and the frequencies are provided for each of these values.
(Multiple Choice)
4.8/5 (42)
If we were interested in predicting grade point average from the number of hours students spend on the internet what should we place on the vertical axis?
(Multiple Choice)
4.9/5 (37)
The absolute value of a correlation coefficient indicates the__________ of the relationship and the sign indicates the of the____________ relationship.
(Multiple Choice)
4.7/5 (33)
When calculating a correlation coefficient,_____________ can only be used when the data are related in a linear fashion.
(Multiple Choice)
4.8/5 (37)
A raw score above the mean of the distribution will result in a z score
(Multiple Choice)
4.8/5 (42)
A sample consists of n = 25 scores. How many of the scores are used to calculate the range?
(Multiple Choice)
4.8/5 (34)
Filters
- Essay(0)
- Multiple Choice(0)
- Short Answer(0)
- True False(0)
- Matching(0)