Exam 20: Visual Analysis of Single-System Design Data
Exam 1: Integrating Evaluation and Practice: Introduction to5 Questions
Exam 2: Basic Principles of Conceptualization and Measurement11 Questions
Exam 3: Specifying Problems and Goals: Targets of Intervention12 Questions
Exam 4: Developing a Measurement and Recording Plan8 Questions
Exam 5: Behavioral Observation14 Questions
Exam 6: Individualized Rating Scales8 Questions
Exam 7: Standardized Scales8 Questions
Exam 8: Logs5 Questions
Exam 9: Reactivity and Non-Reactive Measures10 Questions
Exam 10: Selecting a Measure3 Questions
Exam 11: Basic Principles of Single-System Designs17 Questions
Exam 12: Baselining: Collecting Information Before Intervention13 Questions
Exam 13: From the Case Study to the Basic Single-System Design: A-B6 Questions
Exam 14: The Experimental Single-System Designs: A-B-A, A-B-A-B, B-A-B12 Questions
Exam 15: Multiple Designs for Single Systems: Baselines, Targets, Crossovers, and Series7 Questions
Exam 16: Changing Intensity Designs and Successive Intervention Designs7 Questions
Exam 17: Designs for Comparing Interventions4 Questions
Exam 18: Selecting a Design2 Questions
Exam 19: Basic Principles of Analysis19 Questions
Exam 20: Visual Analysis of Single-System Design Data7 Questions
Exam 21: Descriptive Statistics5 Questions
Exam 22: Tests of Statistical Significance for Single-System Designs10 Questions
Exam 24: Selecting a Procedure for Analyzing Data4 Questions
Exam 25: Not for Practitioners Alone: Evaluation for Clients, Administrators, Educators, and Students5 Questions
Select questions type
The pattern of this chart shows: 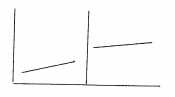
Free
(Multiple Choice)
4.7/5  (44)
(44)
Correct Answer: Verified
B
Visual analysis of data is particularly reliable because one does not have to be concerned about the possibility of autocorrelation.
Free
(True/False)
4.9/5 (29)
Correct Answer:Verified
False
The pattern of this chart shows: 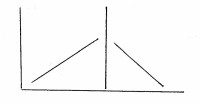
Free
(Multiple Choice)
4.7/5 (31)
Correct Answer:Verified
A
Can you have a stable trend if the line made up of linked data points is continuously up and down? Draw a diagram indicating your answer.
(True/False)
4.9/5 (33)
Directionality in the data-whether within or across phases-is called slope.
(True/False)
4.8/5 (22)
What do you make of a situation where the client's behavior changes from bad to good to bad during baseline? Should you start the intervention with a sense of stability, if curvilinear, behaviors?
(True/False)
4.8/5 (35)
Filters
- Essay(0)
- Multiple Choice(0)
- Short Answer(0)
- True False(0)
- Matching(0)