Exam 13: Multiple Regression and Correlation Analysis
Exam 1: What Is Statistics78 Questions
Exam 2: Describing Data: Frequency Distributions and Graphic Presentation101 Questions
Exam 3: Describing Data: Numerical Measures186 Questions
Exam 4: A Survey of Probability Concepts121 Questions
Exam 5: Discrete Probability Distributions111 Questions
Exam 6: The Normal Probability Distribution129 Questions
Exam 7: Sampling Methods and the Central Limit Theorem78 Questions
Exam 8: Estimation and Confidence Intervals128 Questions
Exam 9: One-Sample Tests of a Hypothesis223 Questions
Exam 10: Two-Sample Tests of Hypothesis87 Questions
Exam 11: Analysis of Variance80 Questions
Exam 12: Linear Regression and Correlation150 Questions
Exam 13: Multiple Regression and Correlation Analysis98 Questions
Exam 14: Chi-Square Applications for Nominal Data113 Questions
Exam 15: Index Numbers65 Questions
Exam 16: Time Series and Forecasting86 Questions
Exam 17: An Introduction to Decision Theory37 Questions
Select questions type
When does multicollinearity occur in a multiple regression analysis?
(Multiple Choice)
4.8/5  (40)
(40)
i. The multiple coefficient of determination, R2, reports the proportion of the variation in Y that is explained by the variation in the set of independent variables.
ii. The coefficient of multiple determination reports the strength of the association between the dependent variable and the set of independent variables.
Iii) A multiple correlation determination equalling -0.76 is definitely possible.
(Multiple Choice)
4.8/5 (38)
Twenty-one executives in a large corporation were randomly selected for a study in which several factors were examined to determine their effect on annual salary (expressed in $000's). The factors selected were age, seniority, years of college, number of company divisions they had been exposed to and the level of their responsibility. A regression analysis was performed using a popular spreadsheet program with the following regression output:
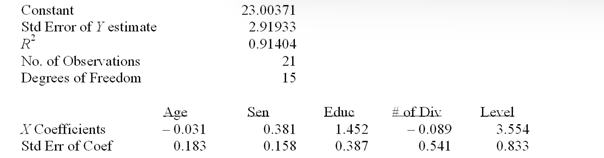 -What is the proportion of the variation in salary accounted for by the set of independent variables?____________
(Short Answer)
4.8/5 (42)
Twenty-one executives in a large corporation were randomly selected for a study in which several factors were examined to determine their effect on annual salary (expressed in $000's). The factors selected were age, seniority, years of college, number of company divisions they had been exposed to and the level of their responsibility. A regression analysis was performed using a popular spreadsheet program with the following regression output:
-Write out the multiple regression equation____________.
(Essay)
4.8/5 (29)
Which test statistic do we apply to test the null hypothesis that the multiple regression coefficients are all zero?
(Multiple Choice)
4.8/5 (24)
Multiple regression analysis is applied when analyzing the relationship between
(Multiple Choice)
4.9/5 (40)
The following correlations were computed as part of a multiple regression analysis that used education, job, and age to predict income. 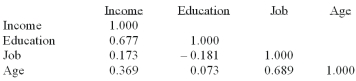 Which independent variable has the strongest association with the dependent variable?
(Multiple Choice)
4.9/5 (41)
The production of automobile tires in any given year is related to the number of automobiles produced this year and in prior years. Suppose our econometric model resulted in the following data.
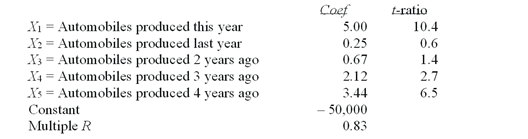 -How much does tire production increase for every thousand cars produced two years ago?____________
(Short Answer)
4.8/5 (29)
Hypotheses concerning individual regression coefficients are tested using which statistic?
(Multiple Choice)
4.9/5 (32)
What is the estimated index of satisfaction for a person who first married at 25, has an annual income of $26,500, has two children, has assets of $156,000, has in index of health status of 141, and has 2.5 social activities per week?
A sample of General Mills employees was studied to determine their degree of satisfaction with their present life. A special index, called the index of satisfaction, was used to measure satisfaction. Six factors were studied: age at the time of first marriage (X1), annual income (X2), number of children living (X3), value of all assets (X4), status of health in the form of an index (X5), and the average number of social activities per week (X6). Suppose the multiple regression equation is:
Y' = 16.24 + 0.017X1 + 0.00028X2 + 42X3 + 0.0012X4 + 0.19X5 + 26.8X6
(Multiple Choice)
4.9/5 (39)
What is the estimated index of satisfaction for a person who first married at 25, has an annual income of $46,000, has two children, has assets of $200,000, has in index of health status of 141, and has 2.5 social activities per week?
A sample of General Mills employees was studied to determine their degree of satisfaction with their present life. A special index, called the index of satisfaction, was used to measure satisfaction. Six factors were studied: age at the time of first marriage (X1), annual income (X2), number of children living (X3), value of all assets (X4), status of health in the form of an index (X5), and the average number of social activities per week (X6). Suppose the multiple regression equation is:
Y' = 16.24 + 0.017X1 + 0.00028X2 + 42X3 + 0.0012X4 + 0.19X5 + 26.8X6
(Multiple Choice)
4.8/5 (43)
i. The values of b1, b2 and b3 in a multiple regression equation are called the net regression coefficients. They indicate the change in the predicted value for a unit change in one X when the other X variables are held constant.
ii. Multiple regression analysis examines the relationship of several dependent variables on the independent variable.
Iii) A multiple regression equation defines the relationship between the dependent variable and the independent variables in the form of an equation.
(Multiple Choice)
4.8/5 (44)
Angela Chou has been asked to investigate the determinants of poverty in Ontario communities. She collected data on 60 communities from Statistics Canada. She selected the percentage of poor persons living under the poverty line [Poor (%)], measured by Low Income Cut-Off, designed by Statistics Canada as a measure of poverty for a community, as the dependent variable. The independent variables selected are percent of single families in each community, the unemployment rate in each community, and percent of population in the community holding a bachelor's degree as their highest level of education attained. ![Angela Chou has been asked to investigate the determinants of poverty in Ontario communities. She collected data on 60 communities from Statistics Canada. She selected the percentage of poor persons living under the poverty line [Poor (%)], measured by Low Income Cut-Off, designed by Statistics Canada as a measure of poverty for a community, as the dependent variable. The independent variables selected are percent of single families in each community, the unemployment rate in each community, and percent of population in the community holding a bachelor's degree as their highest level of education attained. Determine the regression equation.](https://storage.examlex.com/TB7521/11eb23f8_d3a1_f46b_8c87_87cabfbc5088_TB7521_00.jpg) Determine the regression equation.
Determine the regression equation.
(Multiple Choice)
4.8/5 (34)
The production of automobile tires in any given year is related to the number of automobiles produced this year and in prior years. Suppose our econometric model resulted in the following data.
-How much does tire production change for every thousand cars produced three years ago?____________
(Short Answer)
4.8/5 (41)
The best example of a null hypothesis for a global test of a multiple regression model is:
(Multiple Choice)
4.8/5 (35)
i. Multiple R2 measures the proportion of explained variation.
ii. 90% of total variation in the dependent variable is explained by the independent variable for a multiple R2= 0.90.
Iii) The multiple standard error of estimate measures the variation about the regression plane when two independent variables are considered.
(Multiple Choice)
4.8/5 (32)
The following correlations were computed as part of a multiple regression analysis that used education, job, and age to predict income. 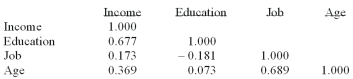 Which is the dependent variable?
(Multiple Choice)
4.9/5 (37)
Filters
- Essay(0)
- Multiple Choice(0)
- Short Answer(0)
- True False(0)
- Matching(0)