Exam 13: Multiple Regression and Correlation Analysis
Exam 1: What Is Statistics78 Questions
Exam 2: Describing Data: Frequency Distributions and Graphic Presentation101 Questions
Exam 3: Describing Data: Numerical Measures186 Questions
Exam 4: A Survey of Probability Concepts121 Questions
Exam 5: Discrete Probability Distributions111 Questions
Exam 6: The Normal Probability Distribution129 Questions
Exam 7: Sampling Methods and the Central Limit Theorem78 Questions
Exam 8: Estimation and Confidence Intervals128 Questions
Exam 9: One-Sample Tests of a Hypothesis223 Questions
Exam 10: Two-Sample Tests of Hypothesis87 Questions
Exam 11: Analysis of Variance80 Questions
Exam 12: Linear Regression and Correlation150 Questions
Exam 13: Multiple Regression and Correlation Analysis98 Questions
Exam 14: Chi-Square Applications for Nominal Data113 Questions
Exam 15: Index Numbers65 Questions
Exam 16: Time Series and Forecasting86 Questions
Exam 17: An Introduction to Decision Theory37 Questions
Select questions type
What can we conclude if the net regression coefficients in the population are not significantly different from zero?
(Multiple Choice)
4.8/5  (35)
(35)
i. The coefficient of multiple determination reports the strength of the association between the dependent variable and the set of independent variables.
ii. The multiple standard error of estimate for two independent variables measures the variation about a regression plane.
Iii) A multiple correlation determination equalling -0.76 is definitely possible.
(Multiple Choice)
4.8/5 (39)
In a regression analysis, three independent variables are used in the equation based on a sample of forty observations. What are the degrees of freedom associated with the F-statistic?
(Multiple Choice)
4.9/5 (36)
What is the estimated index of satisfaction for a person who first married at 25, has an annual income of $100,000, has two children, has assets of $500,000, has in index of health status of 141, and has 2 social activities per week?
A sample of General Mills employees was studied to determine their degree of satisfaction with their present life. A special index, called the index of satisfaction, was used to measure satisfaction. Six factors were studied: age at the time of first marriage (X1), annual income (X2), number of children living (X3), value of all assets (X4), status of health in the form of an index (X5), and the average number of social activities per week (X6). Suppose the multiple regression equation is:
Y' = 16.24 + 0.017X1 + 0.00028X2 + 42X3 + 0.0012X4 + 0.19X5 + 26.8X6
(Multiple Choice)
4.8/5 (24)
How is the Y intercept in the multiple regression equation represented?
(Multiple Choice)
4.8/5 (32)
i. Multiple regression analysis examines the relationship of several dependent variables on the independent variable.
Ii) A multiple regression equation defines the relationship between the dependent variable and the independent variables in the form of an equation.
Iii) Autocorrelation often happens when data has been collected over periods of time.
(Multiple Choice)
4.8/5 (26)
If the correlation between the two independent variables of a regression analysis is 0.11 and each independent variable is highly correlated to the dependent variable, what does this indicate?
(Multiple Choice)
4.9/5 (32)
i. A variable whose possible outcomes are coded as a "1" or a "0" is called a dummy variable.
ii. If the null hypothesis ?4 = 0 is not rejected, then the independent variable X4 has no effect in predicting the dependent variable.
Iii) A dummy variable is added to the regression equation to control for error.
(Multiple Choice)
4.7/5 (33)
i. If an inverse relationship exists between the dependent variable and independent variables, the regression coefficients for the independent variables are positive.
Ii) Given a multiple linear equation Y' = 5.1 + 2.2X1 - 3.5X2, assuming other things are held constant, an increase of one unit in the second independent variable will cause a -3.5 unit change in Y.
Iii) When the variance of the differences between the actual and the predicted values of the dependent variable are approximately the same, the variables are said to exhibit homoscedasticity.
(Multiple Choice)
4.8/5 (37)
i. Multiple regression is used when two or more independent variables are used to predict a value of a single dependent variable.
Ii) The values of b1, b2 and b3 in a multiple regression equation are called the net regression coefficients. They indicate the change in the predicted value for a unit change in one X when the other X variables are held constant.
Iii) Autocorrelation often happens when data has been collected over periods of time.
(Multiple Choice)
4.8/5 (33)
It has been hypothesized that overall academic success for freshmen at college as measured by grade point average (GPA) is a function of IQ scores (X1), hours spent studying each week (X2), and one's high school average (X3). Suppose the regression equation is:
Y' = -6.9 + 0.055X1 + 0.107X2 + 0.0083X3.
The multiple standard error is 6.313 and R2 = 0.826.
-How many dependent variables are in the regression equation?____________
(Short Answer)
4.9/5 (26)
i. If the null hypothesis β4 = 0 is not rejected, then the independent variable X4 has a strong effect in predicting the dependent variable ii. A dummy variable is added to the regression equation to control for error.
Iii) A variable whose possible outcomes are coded as a "1" or a "0" is called a strong independent variable.
(Multiple Choice)
4.8/5 (31)
Angela Chou has been asked to investigate the determinants of poverty in Ontario communities. She collected data on 60 communities from Statistics Canada. She selected the percentage of poor persons
Living under the poverty line [Poor (%)], measured by Low Income Cut-Off, and designed by Statistics
Canada as a measure of poverty for a community, as the dependent variable. The independent variables selected are percent of single families in each community, the unemployment rate in each community, percent of population in the community holding a bachelor's degree as their highest level of education attained, and percent of population holding a High School Diploma as their highest level of education attained. Using the output below, determine which variable Angela should consider deleting. ![Angela Chou has been asked to investigate the determinants of poverty in Ontario communities. She collected data on 60 communities from Statistics Canada. She selected the percentage of poor persons Living under the poverty line [Poor (%)], measured by Low Income Cut-Off, and designed by Statistics Canada as a measure of poverty for a community, as the dependent variable. The independent variables selected are percent of single families in each community, the unemployment rate in each community, percent of population in the community holding a bachelor's degree as their highest level of education attained, and percent of population holding a High School Diploma as their highest level of education attained. Using the output below, determine which variable Angela should consider deleting.](https://storage.examlex.com/TB7521/11eb23f8_d3a5_ec10_8c87_89b556a1d010_TB7521_00.jpg)
(Multiple Choice)
4.8/5 (32)
How is the degree of association between the set of independent variables and the dependent variable is measured?
(Multiple Choice)
4.8/5 (38)
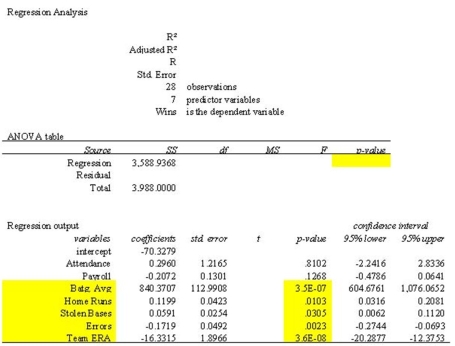 The information above is from the multiple regression analysis computer output for 28 teams in Major League Baseball. The model is designed to predict wins using attendance, payroll, batting average, home runs, stolen bases, errors, and team ERA. The t-value computed for testing the coefficient "Batg. Avg." is:
(Multiple Choice)
4.8/5 (36)
If there are four independent variables in a multiple regression equation, there are also four
(Multiple Choice)
4.8/5 (32)
i. 90% of total variation in the dependent variable is explained by the independent variable for a multiple R2= 0.90.
ii. The multiple standard error of estimate measures the variation about the regression plane when two independent variables are considered.
Iii) The multiple coefficient of determination, R2, reports the proportion of the variation in Y that is not
Explained by the variation in the set of independent variables.
(Multiple Choice)
4.8/5 (28)
A real estate agent developed a model to relate a house's selling price (Y) to the area of floor space (X) and the area of floor space squared (X2). The multiple regression equation for this model is:
Y = 125 - 3X + X2
where: Y = selling price (times $1,000)
X = square feet of floor space (times 100)
-What is the selling price of a house with 1,000 square feet?____________
(Short Answer)
4.8/5 (27)
The following correlations were computed as part of a multiple regression analysis that used education, job, and age to predict income. 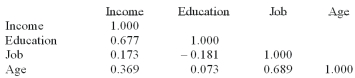 What is this table called?
(Multiple Choice)
4.7/5 (31)
Filters
- Essay(0)
- Multiple Choice(0)
- Short Answer(0)
- True False(0)
- Matching(0)