Exam 8: Estimation and Confidence Intervals
Exam 1: What Is Statistics78 Questions
Exam 2: Describing Data: Frequency Distributions and Graphic Presentation101 Questions
Exam 3: Describing Data: Numerical Measures186 Questions
Exam 4: A Survey of Probability Concepts121 Questions
Exam 5: Discrete Probability Distributions111 Questions
Exam 6: The Normal Probability Distribution129 Questions
Exam 7: Sampling Methods and the Central Limit Theorem78 Questions
Exam 8: Estimation and Confidence Intervals128 Questions
Exam 9: One-Sample Tests of a Hypothesis223 Questions
Exam 10: Two-Sample Tests of Hypothesis87 Questions
Exam 11: Analysis of Variance80 Questions
Exam 12: Linear Regression and Correlation150 Questions
Exam 13: Multiple Regression and Correlation Analysis98 Questions
Exam 14: Chi-Square Applications for Nominal Data113 Questions
Exam 15: Index Numbers65 Questions
Exam 16: Time Series and Forecasting86 Questions
Exam 17: An Introduction to Decision Theory37 Questions
Select questions type
The proportion of junior executives leaving large manufacturing companies within three years is to be estimated within 3 percent. The 0.95 degree of confidence is to be used. A study conducted several years ago revealed that the percent of junior executives leaving within three years was 21. To update this study, the files of how many junior executives should be studied?
(Multiple Choice)
4.8/5  (34)
(34)
The t distribution approaches as the sample size increases. As the sample size increases, the computed value of t .
(Multiple Choice)
4.8/5 (34)
The Sugar Producers Association wants to estimate the mean yearly sugar consumption. A sample of 16 people reveals the mean yearly consumption to be 27 kg with a sample standard deviation of 9 kg. Assume a normal population. Develop a 99% confidence interval for the mean annual consumption of sugar.
(Multiple Choice)
4.8/5 (39)
A survey of an urban university (population of 25,450) showed that 870 of 1,100 students sampled supported a fee increase to fund improvements to the student recreation center. If university officials say that at least 70% of the voting student population support the fee increase, what conclusion can be drawn based on a 95% level of confidence?
(Multiple Choice)
4.8/5 (45)
The mean number of travel days per year for the outside salespeople employed by hardware distributors is to be estimated. The 0.90 degree of confidence is to be used. The mean of a small pilot study was 150 days, with a standard deviation of 14 days. If the population mean is to be estimated within two days, how many outside salespeople should be sampled?
(Multiple Choice)
4.8/5 (34)
The Dean of the Business School wants to estimate the mean number of hours worked per week by students. A sample of only 12 students showed a mean of 24 hours with a standard deviation of 4 hours. Find the 95 percent confidence interval for the population mean.
(Multiple Choice)
4.9/5 (35)
Dr. Patton is a professor of English. Recently she counted the number of misspelled works in a group of student essays. She noted the distribution of misspelled words per essay followed the normal distribution with a standard deviation of 2.44 words per essay. For her Tuesday class of 44 students, the mean number of misspelled words per essay was 6.05. Construct a 90% confidence interval for the mean number of misspelled words in the population of student essays.
(Multiple Choice)
4.7/5 (44)
In order to construct a 90% confidence interval for the population mean when the population standard deviation is unknown and the sample size is 18, you should use the t-value indicated as:
(Multiple Choice)
4.9/5 (42)
The following summarizes the average price of Air Canada stock at the end of 20 randomly selected weeks in 2000. 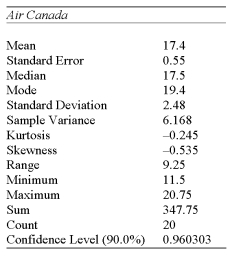 Determine a 95% confidence interval for the average Air Canada stock price in 2000.
(Multiple Choice)
4.9/5 (39)
A survey of 144 retail stores revealed that the average price of a DVD was $375 with a standard error of $20. If 90% and 95% confidence intervals were developed to estimate the true cost of the DVD, what similarities would they have?
(Multiple Choice)
4.7/5 (35)
In order to construct a 95% confidence interval for the population mean when the population standard deviation is unknown and the sample size is 15, you should use the t-value indicated as:
(Multiple Choice)
4.8/5 (39)
i. The t distribution is based on the assumption that the population of interest is normal or nearly normal.
Ii) The t distribution is a continuous distribution.
Iii) There is not one t distribution, but rather a "family" of t distributions.
(Multiple Choice)
4.8/5 (33)
A sample of 25 is selected from a known population of 100 elements. What is the finite population correction factor?
(Multiple Choice)
4.9/5 (34)
Which of the following is NOT necessary to determine how large a sample to select from a population?
(Multiple Choice)
4.8/5 (37)
The Sugar Producers Association wants to estimate the mean yearly sugar consumption. A sample of 25 people reveals the mean yearly consumption to be 27 kg with a sample standard deviation of 9 kg. Assume a normal population. For a 99% confidence interval, what is the critical value needed?
(Multiple Choice)
4.9/5 (33)
The following summarizes the amount of snowfall in Ontario over the past number of years. 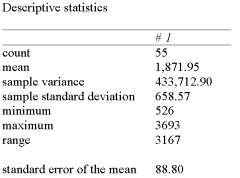 If 90% and 95% confidence intervals were developed to estimate the true average annual snowfall, what similarities would they have?
(Multiple Choice)
4.8/5 (35)
Recently, a university surveyed recent graduates of the English Department for their starting salaries. Four hundred graduates returned the survey. The average salary was $25,000. The population standard deviation is known to be $2,500.
What is the 95% confidence interval for the mean salary of all graduates from the English
Department?
(Multiple Choice)
4.7/5 (39)
i. The Student t distribution has a greater spread than does the z distribution. As a result, the critical values of t for a given level of significance are larger in magnitude than the corresponding z critical values.
Ii) The test statistic t has n-1 degrees of freedom.
Iii) William S. Gosset, a brewmaster, developed the t test for the Guinness Brewery in Ireland, who published it in 1908 using the pen name "Student."
(Multiple Choice)
4.9/5 (37)
i. The test statistic for a problem involving a small sample of fewer than 30 and an unknown population standard deviation is the Student's t distribution.
Ii) The t distribution approaches the Z distribution as the sample size increases.
iii. As the sample size increases, the computed value of t decreases
(Multiple Choice)
4.8/5 (45)
Filters
- Essay(0)
- Multiple Choice(0)
- Short Answer(0)
- True False(0)
- Matching(0)