Exam 11: Goodness-Of-Fit and Contingency Tables
Exam 1: Introduction to Statistics60 Questions
Exam 2: Exploring Data With Tables and Graphs60 Questions
Exam 3: Describing, Exploring, and Comparing Data60 Questions
Exam 4: Probability60 Questions
Exam 5: Discrete Probability Distributions60 Questions
Exam 6: Normal Probability Distributions60 Questions
Exam 7: Estimating Parameters and Determining Sample Sizes60 Questions
Exam 8: Hypothesis Testing60 Questions
Exam 9: Inferences From Two Samples60 Questions
Exam 10: Correlation and Regression60 Questions
Exam 11: Goodness-Of-Fit and Contingency Tables60 Questions
Exam 12: Analysis of Variance59 Questions
Exam 13: Nonparametric Tests60 Questions
Exam 14: Statistical Process Control60 Questions
Select questions type
Perform the indicated goodness-of-fit test. Among the four northwestern states, Washington has 51% of the total population, Oregon has 30%, Idaho has 11%, and Montana has 8%. A market
researcher selects a sample of 1000 subjects, with 450 in Washington, 340 in Oregon, 150 in
Idaho, and 60 in Montana. At the 0.05 significance level, test the claim that the sample of 1000
subjects has a distribution that agrees with the distribution of state populations.
Free
(Essay)
4.8/5  (33)
(33)
Correct Answer: Verified
H0 : The distribution of the sample agrees with the population distribution.
H1 : It does not agree.
Test statistic: X2=31.938 . Critical value: X2=7.815 . Reject the null hypothesis. There is sufficient evidence to warrant rejection of the claim that the distribution of the sample agrees with the distribution of the state populations.
A researcher wishes to test whether the proportion of college students who smoke is the same in four different colleges. She randomly selects 100 students from each college and records the number that smoke. The results are shown below.
College A College B College C College D Smoke 17 26 11 34 Don't Smoke 83 74 89 66
Use a 0.01 significance level to test the claim that the proportion of students smoking is the same at all four colleges.
Free
(Essay)
5.0/5 (32)
Correct Answer:Verified
H0: The proportion of students smoking is the same at all four colleges.
H1: At least one of the proportions is different.
Test statistic: Critical value:
Reject the null hypothesis. There is sufficient evidence to warrant rejection of the claim that the proportion of students smoking is the same at all four colleges.
In studying the occurrence of genetic characteristics, the following sample data were obtained. You would like to test the claim that the characteristics occur with the same frequency at the 0.05 significance level.
Characteristic A B C D E F Frequency 28 30 45 48 39 39
What is the expected value for D?
Free
(Multiple Choice)
4.8/5 (29)
Correct Answer:Verified
B
Use a test to test the claim that in the given contingency table, the row variable and the column variable are independent. Responses to a survey question are broken down according to employment status and the sample results are given below. At the 0.10 significance level, test the claim that response and employment status are independent.
Yes No Undecided Employed 30 15 5 Unemployed 20 25 10
(Essay)
4.9/5 (37)
For a recent year, the following are the numbers of homicides that occurred each month in New York City: 38, 30, 46, 40, 46, 49, 47, 50, 50, 42, 37, 37. Use a 0.05 significance level to test theclaim that homicides in New York City are equally likely for each of the 12 months. State your conclusion about the claim.
(Multiple Choice)
4.9/5 (34)
At a high school debate tournament, half of the teams were asked to wear suits and ties and the rest were asked to wear jeans and t-shirts. The results are given in the table below. In order to test the claim at the 0.05 level that the proportion of wins is the same for teams Wearing suits as for teams wearing jeans, what would the null hypothesis be?
Win Loss Suit 22 28 T-Shirt 28 22
(Multiple Choice)
4.8/5 (29)
Use the sample data below to test whether car color affects the likelihood of being in an accident. Use a significance level of 0.01.
Red Blue White Car has been in accident 28 33 36 Car has not been in accident 23 22 30
(Essay)
4.8/5 (24)
Use a 0.01 significance level to test the claim that the proportion of men who plan to vote in the next election is the same as the proportion of women who plan to vote. 300 men and 300 women were randomly selected and asked whether they planned to vote in the next election. The results are shown below.
Men Women Plan to vote 170 185 Do not plan to vote 130 115
(Essay)
4.8/5 (31)
Use a test to test the claim that in the given contingency table, the row variable and the column variable are independent. The table below shows the age and favorite type of music of 668 randomly selected people.
Use a 5 percent level of significance to test the null hypothesis that age and preferred music type are independent.
Rock Pop Classical - 50 85 73 68 91 60 -45 90 74 77
(Essay)
4.9/5 (33)
Perform the indicated goodness-of-fit test. You roll a die 48 times with the following results.
Number 1 2 3 4 5 6 Frequency 4 13 2 14 13 2
Use a significance level of 0.05 to test the claim that the die is fair.
(Essay)
4.8/5 (39)
Among the four northwestern states, Washington has 51% of the total population, Oregon has 30% . Idaho has 11% , and Montana has 8% . A market researcher selects a sample of 1000 subjects, with 450 in Washington, 340 in Oregon, 150 in Idaho, and 60 in Montana. At the 0.05 significance level, test the claim that the sample of 1000 subjects has a distribution that agrees with the distribution of state populations.
(Essay)
4.7/5 (33)
Use a test to test the claim that in the given contingency table, the row variable and the column variable are independent. Tests for adverse reactions to a new drug yielded the results given in the table. At the 0.05 significance level, test the claim that the treatment (drug or placebo) is independent of the reaction (whether or not headaches were experienced).
Drug Placebo Headaches 11 7 No headaches 73 91
(Essay)
4.9/5 (35)
In studying the responses to a multiple-choice test question, the following sample data were obtained. At the 0.05 significance level, test the claim that the responses occur with the same frequency.
Response A B C D E Frequency 12 15 16 18 19
(Essay)
4.9/5 (36)
Explain the computation of expected values for contingency tables in terms of probabilities. Refer to the assumptions of the null hypothesis as part of your explanation. You might give a
brief example to illustrate.
(Essay)
4.8/5 (42)
A table summarizes the success and failures when subjects used different methods (yoga, acupuncture, and chiropractor)to relieve back pain. If we test the claim at a 5% level of
significance that success is independent of the method used, technology provides a P-value of
0.0355. What does the P-value tell us about the claim?
(Essay)
4.9/5 (38)
A survey of students at a college was asked if they lived at home with their parents, rented an apartment, or owned their own home. The results are shown in the table below sorted by gender. At test the claim that living accommodations are independent of the gender of the student.
Live with Parent Rent Apartment Own Home Male 20 26 19 Female 18 28 30
(Essay)
4.9/5 (32)
Goodness-of-fit hypothesis tests are always___________________.
(Multiple Choice)
4.8/5 (35)
According to Benford's Law, a variety of different data sets include numbers with leading (first) digits that follow the distribution shown in the table below. Test for goodness-of-fit with
Benford's Law. 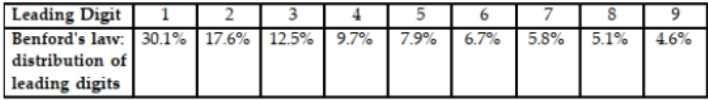 When working for the Brooklyn District Attorney, investigator Robert Burton analyzed the leading digits of the amounts from 784 checks issued by seven suspect companies. The frequencies were found to be 0,12,0,73,482,186,8,23 , and 0 , and those digits correspond to the leading digits of 1,2,3,4,5,6,7,8 , and 9 , respectively. If the observed frequenciesare substantially different from the frequencies expected with Benford's Law, the check amounts appear to result from fraud. Use a 0.05 significance level to test for goodness=of-fit with Benford's Law. What is the value of the test statistic? Does it appear that the checks are the result of fraud?
(Multiple Choice)
4.9/5 (41)
Which of the following is not a characteristic of a chi-square distribution?
(Multiple Choice)
4.9/5 (24)
Perform the indicated goodness-of-fit test. You roll a die 48 times with the following results.
Number 1 2 3 4 5 6 Frequency 4 13 2 14 13 2
Use a significance level of 0.05 to test the claim that the die is fair.
(Essay)
4.9/5 (28)
Filters
- Essay(0)
- Multiple Choice(0)
- Short Answer(0)
- True False(0)
- Matching(0)