Exam 10: Correlation and Regression
Exam 1: Introduction to Statistics60 Questions
Exam 2: Exploring Data With Tables and Graphs60 Questions
Exam 3: Describing, Exploring, and Comparing Data60 Questions
Exam 4: Probability60 Questions
Exam 5: Discrete Probability Distributions60 Questions
Exam 6: Normal Probability Distributions60 Questions
Exam 7: Estimating Parameters and Determining Sample Sizes60 Questions
Exam 8: Hypothesis Testing60 Questions
Exam 9: Inferences From Two Samples60 Questions
Exam 10: Correlation and Regression60 Questions
Exam 11: Goodness-Of-Fit and Contingency Tables60 Questions
Exam 12: Analysis of Variance59 Questions
Exam 13: Nonparametric Tests60 Questions
Exam 14: Statistical Process Control60 Questions
Select questions type
Suppose you will perform a test to determine whether there is sufficient evidence to support a claim of a linear correlation between two variables. Find the critical values of r given the number of pairs of data n and the significance level
n=12,
Free
(Multiple Choice)
4.8/5  (41)
(41)
Correct Answer: Verified
B
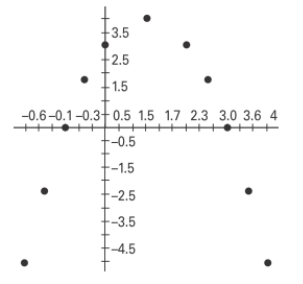
Determine which plot shows the strongest linear correlation.
Free
(Multiple Choice)
4.8/5 (36)
Correct Answer:Verified
C
Sketch an example of a residual plot that suggests that a regression equation is not a good model. Be sure to include at least 10 points in your example.
Free
(Essay)
4.9/5 (29)
Correct Answer:Verified
The following residual plot is obtained after a regression equation is determined for a set of data. Does the residual plot suggest that the regression equation is a bad model? Why or
why not? 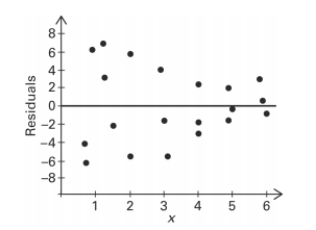
(Essay)
4.9/5 (28)
Use computer software to find the best multiple regression equation to explain the variation in the dependent variable, Y, in terms of the independent variables.
Y 15 1.2 16 15 1.2 16 17 1.0 16 6 0.8 9 1 0.1 1 8 0.8 8 10 0.8 10 17 1.0 16 15 1.2 15 11 0.7 9 18 1.4 18 16 1.0 15 10 0.8 9 7 0.5 5 18 1.1 16
CORRELATION COEFFICIENT
Y/ =0.886 Y/ =0.965
COEFFICIENTS OF DETERMINATION
Yl =0.932 Yl,=0.943
(Multiple Choice)
4.8/5 (37)
Find the value of the linear correlation coefficient r. The paired data below consist of the temperatures on randomly chosen days and the amount a certain kind of plant grew (in millimeters). Temperature 62 76 50 51 71 46 51 44 79 Growth 36 39 50 13 33 33 17 6 16
(Multiple Choice)
4.8/5 (31)
A 0.01 significance level is being used to test a correlation between two variables. If the linear correlation coefficient r is found to be 0.591 and the critical values are what can you conclude?
(Multiple Choice)
4.8/5 (29)
Given the linear correlation coefficient r and the sample size n , determine the critical values of r and use your finding to state whether or not the given r represents a significant linear correlation. Use a significance level of 0.05.
r=-0.816, n=5
(Multiple Choice)
4.7/5 (39)
Use the given information to find the coefficient of determination. A regression equation is obtained for a collection of paired data. It is found that the total variation is 20.711, the explained variation is 18.592, and the unexplained variation is 2.119.
(Multiple Choice)
4.9/5 (36)
Which of the following statements concerning the linear correlation coefficient are true?_ I: If the linear correlation coefficient for two variables is zero, then there is no relationship between the variables.
II: If the slope of the regression line is negative, then the linear correlation coefficient is negative.
III: The value of the linear correlation coefficient always lies between -1 and 1 .
IV: A linear correlation coefficient of 0.62 suggests a stronger linear relationship than a linear correlation coefficient of -0.82 .
(Multiple Choice)
4.8/5 (34)
Find the value of the linear correlation coefficient r. The paired data below consist of the costs of advertising (in thousands of dollars) and the number of products sold (in thousands):
Cost 9 2 3 4 2 5 9 10 Number 85 52 55 68 67 86 83 73
(Multiple Choice)
4.8/5 (43)
A quadratic regression model is fit to a set of sample data consisting of 6 pairs of data. Given that the sum of squares of residuals is 29.73 and that the y -values are 11,14,19,22,26,27 , find
(Multiple Choice)
5.0/5 (37)
Based on the scatterplot, select the most likely value of the linear correlation coefficient r 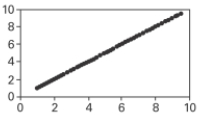
(Multiple Choice)
4.8/5 (39)
Suppose you will perform a test to determine whether there is sufficient evidence to support a claim of a linear correlation between two variables. Find the critical value(s) of r given that n=15 and
(Multiple Choice)
4.8/5 (38)
The table below lists weights (carats) and prices (dollars) for randomly selected diamonds. Find the regression equation, letting the weight be the predictor variable. Find the best predicted price for a diamond with a weight of 1.50 carats. What is wrong with predicting the price of a 1.50 -carat diamond?
Weight 0.3 0.4 0.5 0.5 1.0 0.7 Price 510 1151 1343 1410 5669 2277
(Essay)
4.9/5 (32)
A(n)___________________________ is a point that strongly affects the graph of the regression line.
(Multiple Choice)
4.9/5 (31)
A regression equation is obtained for a set of data. After examining a scatter diagram, the researcher notices a data point that is potentially an influential point. How could she
confirm that this data point is indeed an influential point?
(Essay)
4.9/5 (31)
A(n)___________________________ is a point lying far away from other data points on a scatterplot.
(Multiple Choice)
4.9/5 (38)
Use the given data to find the best predicted value of the response variable. Ten pairs of data yield r=0.003 and the regression equation Also, What is the best predicted value of y for x=2 ?
(Multiple Choice)
4.9/5 (35)
The residual is the ________________ the observed value of y and the predicted value of y
(Multiple Choice)
4.8/5 (35)
Filters
- Essay(0)
- Multiple Choice(0)
- Short Answer(0)
- True False(0)
- Matching(0)