Exam 12: Analysis of Variance
Exam 1: Introduction to Statistics60 Questions
Exam 2: Exploring Data With Tables and Graphs60 Questions
Exam 3: Describing, Exploring, and Comparing Data60 Questions
Exam 4: Probability60 Questions
Exam 5: Discrete Probability Distributions60 Questions
Exam 6: Normal Probability Distributions60 Questions
Exam 7: Estimating Parameters and Determining Sample Sizes60 Questions
Exam 8: Hypothesis Testing60 Questions
Exam 9: Inferences From Two Samples60 Questions
Exam 10: Correlation and Regression60 Questions
Exam 11: Goodness-Of-Fit and Contingency Tables60 Questions
Exam 12: Analysis of Variance59 Questions
Exam 13: Nonparametric Tests60 Questions
Exam 14: Statistical Process Control60 Questions
Select questions type
There is a(n)____________________ between two factors if the effect of one of the factors changes for different categories of the other factor.
Free
(Multiple Choice)
4.8/5  (26)
(26)
Correct Answer: Verified
B
Use the data in the given table and the corresponding Minitab display to test the hypothesis. The following table shows the mileage for four different cars and three different brands of
gas. Assuming no effect from the interaction between car and brand of gas, test the claim
that the four cars have the same mean mileage. Use a 0.05 significance level. 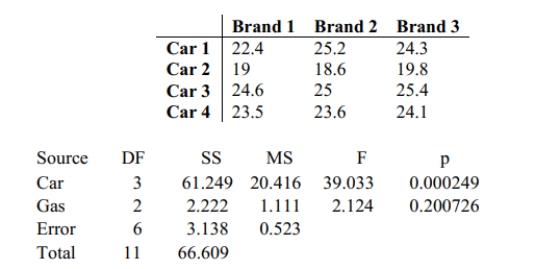
Free
(Essay)
4.8/5 (34)
Correct Answer:Verified
H0: The cars have the same mean mileage. H1: The cars do not have the same mean mileage. The P -value is 0.000249 , which is less than 0.05 . We reject the null hypothesis; it appears that the cars do not have the same mileage.
Use the Minitab display to test the indicated claim. A manager records the production output of three employees who each work on three different machines for three different days. The
sample results are given below and the Minitab results follow. 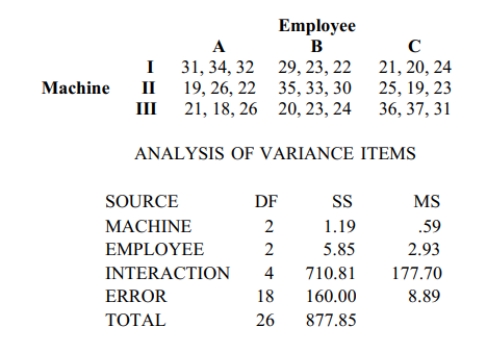 Assume that the number of items produced is not affected by an interaction between
employee and machine. Using a 0.05 significance level, test the claim that the machine has no
effect on the number of items produced.
Assume that the number of items produced is not affected by an interaction between
employee and machine. Using a 0.05 significance level, test the claim that the machine has no
effect on the number of items produced.
Free
(Essay)
4.9/5 (38)
Correct Answer:Verified
H0: There is no machine effect.
H1 : There is a machine effect.
Test statistic: F=0.0664 . Critical value: F=3.5546 .
Fail to reject the null hypothesis. The type of machine does not appear to have an effect on the number of items produced.
List the assumptions for testing hypotheses that three or more means are equivalent.
(Essay)
4.8/5 (31)
Given below are the analysis of variance results from a Minitab display. to use a 0.05 significance level in testing the null hypothesis that the different samples come from populations with the same mean. Identify the P-value. Source DF Factor 3 30 10.00 1.6 0.264 Error 8 50 6.25 Total 11 80
(Multiple Choice)
4.8/5 (39)
The data below represent the weight losses for people on three different exercise programs
Exercise A Exercise B Exercise C 2.5 5.8 4.3 8.8 4.9 6.2 7.3 1.1 5.8 9.8 7.8 8.1 5.1 1.2 7.9
If we want to test the claim that the three size categories have the same means, why don't we use three separate hypothesis tests for 1= 2= 3 , and 1 = 3
(Essay)
4.9/5 (43)
Use the data in the given table and the corresponding Minitab display to test the hypothesis. The following table shows the mileage for four different cars and three different brands of
gas. Assuming no effect from the interaction between car and brand of gas, test the claim that
the three brands of gas provide the same mean gas mileage. Use a 0.05 significance level. Brand 1 Brand 2 Brand 3 Car 1 22.4 25.2 24.3 Car 2 19 18.6 19.8 Car 3 24.6 25 25.4 Car 4 23.5 23.6 24.1 Source DF SS MS F p Car 3 61.249 20.416 39.033 0.000249 Gas 2 2.222 1.111 2.124 0.200726 Error 6 3.138 0.523 Total 11 66.609
(Essay)
4.8/5 (29)
Suppose you are to test for equality of four different population means, with Write the hypotheses for the paired tests. Use methods of probability to explain why the process of ANOVA has a higher degree of confidence than testing each of the pairs separately.
(Essay)
4.8/5 (33)
Test the claim that the samples come from populations with the same mean. Assume that the populations are normally distributed with the same variance. At the 0.025 significance level,test the claim that the four brands have the same mean if the following sample results have been obtained.
Brand A Brand B Brand C Brand D 17 18 21 22 20 18 24 25 21 23 25 27 22 25 26 29 21 26 29 35 29 36 37
(Essay)
4.9/5 (34)
Use the Minitab display to test the indicated claim. A manager records the production output of three employees who each work on three different machines for three different days. The sample results are given below and the Minitab results follow. 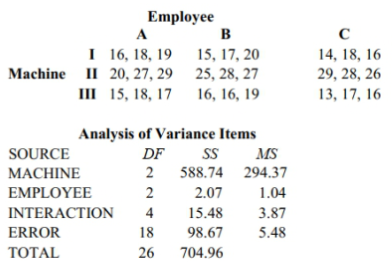 Using a 0.05 significance level, test the claim that the interaction between employee and machine has no effect on the number of items produced. State your conclusion about the null hypothesis and the claim.
(Multiple Choice)
4.9/5 (40)
Use the Minitab display to test the indicated claim. A manager records the production output of three employees who each work on three different machines for three different days. The
sample results are given below and the Minitab results follow. 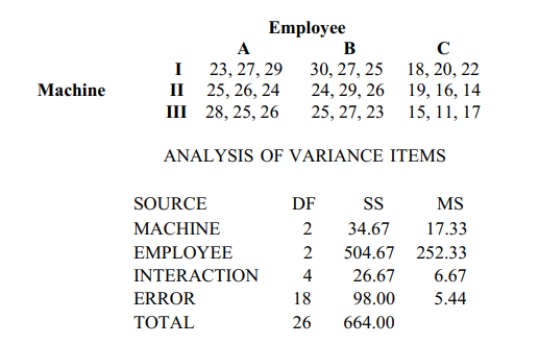
(Essay)
4.9/5 (32)
The following data shows annual income, in thousands of dollars, categorized according to the two factors of gender and level of education. Assume that incomes are not affected by an interaction between gender and level of education, and test the null hypothesis that level of education has no effect on income. Use a 0.05 significance level.
Female Male High school 23,27,24,26 25,26,22,24 College 28,36,31,33 35,32,39,28 Advanced degree 41,38,43,49 35,50,47,44
(Essay)
4.8/5 (25)
The following results are from a statistics software package in which all of the F values and P-
values are given. Is there a significant effect from the interaction? Should you test to see if
there is a significant effect due to either A or B? If the answer is yes, is there a significant
effect due to either A or B? 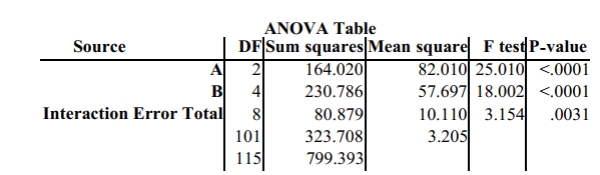
(Essay)
4.8/5 (35)
At the same time each day, a researcher records the temperature in each of three classrooms. The table shows the temperatures in degrees Fahrenheit recorded for one week. 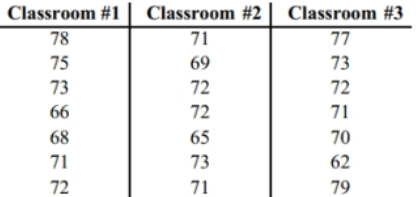 How are the analysis of variance results affected if the same constant is added to every one of the original sample values?
(Multiple Choice)
4.9/5 (42)
Use the Minitab display to test the indicated claim. A manager records the production output of three employees who each work on three different machines for three different days. The
sample results are given below and the Minitab results follow. 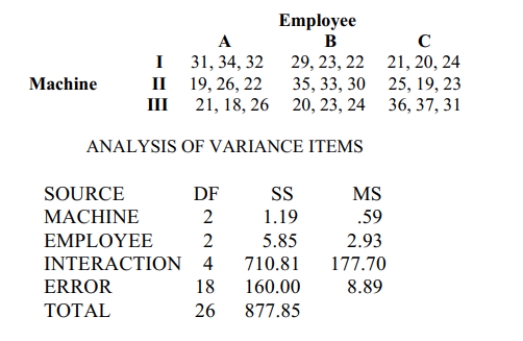 Using a 0.05 significance level, test the claim that the interaction between employee and
machine has no effect on the number of items produced.
Using a 0.05 significance level, test the claim that the interaction between employee and
machine has no effect on the number of items produced.
(Essay)
4.8/5 (38)
Why is it unnecessary to conduct multiple comparison tests after a nonsignificant F test statistic results?
(Essay)
4.9/5 (42)
Why do researchers concentrate on explaining an interaction in a two-way ANOVA rather than the effects of each factor separately?
(Essay)
4.8/5 (34)
List the assumptions for testing hypotheses that three or more means are equivalent.
(Essay)
4.9/5 (37)
Suppose you are to test for equality of four different population means, with Write the hypotheses for the paired tests. Use methods of probability to explain why the process of ANOVA has a higher degree of confidence than testing each of the pairs separately.
(Essay)
5.0/5 (37)
Given below are the analysis of variance results from a Minitab display. Assume that you want to use a 0.05 significance level in testing the null hypothesis that the different samples come from populations with the same mean. Find the critical value.
Source Factor 3 30 10.00 1.6 0.264 Error 8 50 6.25 Total 11 80
(Multiple Choice)
4.8/5 (40)
Filters
- Essay(0)
- Multiple Choice(0)
- Short Answer(0)
- True False(0)
- Matching(0)