Exam 14: Statistical Process Control
Exam 1: Introduction to Statistics60 Questions
Exam 2: Exploring Data With Tables and Graphs60 Questions
Exam 3: Describing, Exploring, and Comparing Data60 Questions
Exam 4: Probability60 Questions
Exam 5: Discrete Probability Distributions60 Questions
Exam 6: Normal Probability Distributions60 Questions
Exam 7: Estimating Parameters and Determining Sample Sizes60 Questions
Exam 8: Hypothesis Testing60 Questions
Exam 9: Inferences From Two Samples60 Questions
Exam 10: Correlation and Regression60 Questions
Exam 11: Goodness-Of-Fit and Contingency Tables60 Questions
Exam 12: Analysis of Variance59 Questions
Exam 13: Nonparametric Tests60 Questions
Exam 14: Statistical Process Control60 Questions
Select questions type
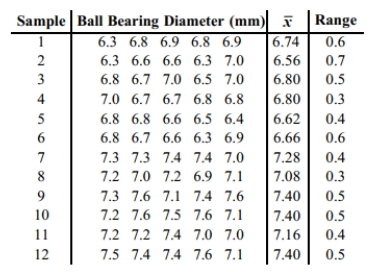
Construct a run chart for individual values corresponding to the given data. A machine that supposed to produce ball bearings with a diameter of 7 millimeters yields the following d from a test of 5 ball bearings every 20 minutes.
Free
(Essay)
4.9/5  (33)
(33)
Correct Answer: Verified
Use the given process data to construct a control chart for p. A drugstore considers a wait of more than 5 minutes to be a defect. Each week 100 customers are randomly selected and timed at the checkout line. The numbers of defects for 20 consecutive weeks are given below. 4 4 5 5 5 5 5 6 6 6 6 12 6 6 6 7 6 7 8 7 What is the value of the upper control limit?
Free
(Multiple Choice)
4.9/5 (33)
Correct Answer:Verified
C
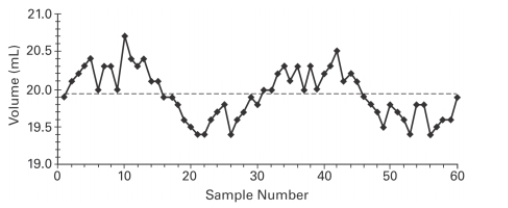
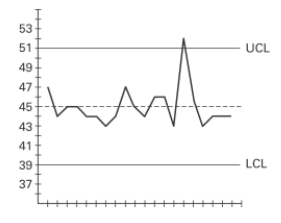
Examine the given run chart or control chart and determine whether the process is within statistical control. If it is not, identify which of the three out-of-statistical-control criteria apply.
Free
(Essay)
4.9/5 (37)
Correct Answer:Verified
The process appears to be out of statistical control. There is a cyclical pattern.
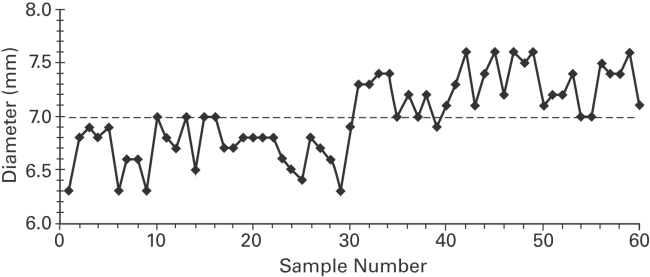
A run chart for individual values is shown below. Does there appear to be a pattern suggesting that the process is not within statistical control? If so, describe the pattern. 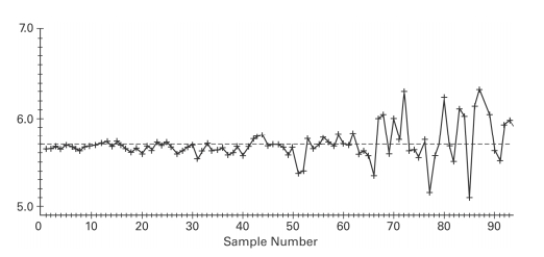
(Essay)
4.9/5 (41)
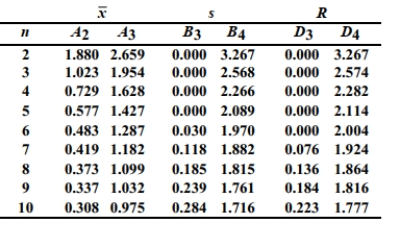
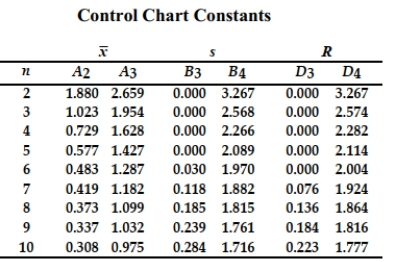
Control Chart Constants
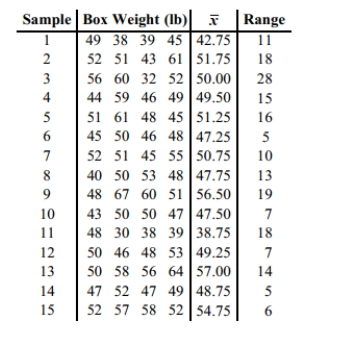
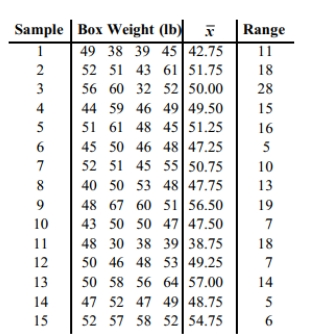
 A machine is supposed to fill boxes to a weight of 50 pounds. Every 30 minutes a sample of four boxes is tested; the results are given below.
(Essay)
4.8/5 (33)
Construct a run chart for individual values corresponding to the given data. A machine is supposed to fill boxes to a weight of 50 pounds. Every 30 minutes a sample of four boxes is tested; the results are given below.
(Essay)
4.7/5 (39)
Examine the given run chart or control chart and determine whether the process is within statistical control. If it is not, identify which of the three out-of-statistical-control criteria apply. 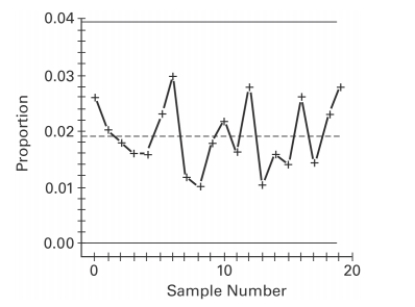
(Essay)
4.9/5 (33)
A control chart for attributes is to be constructed. limits, a process which has been having a 5% rate of nonconforming items, or a process which
has been having a 10% of nonconforming items? Assume that both processes have the same
sample sizes. For a given sample size, would it be easier to detect a shift from 5% to 10% or a
shift from 10% to 15%? Explain your reasoning.
(Essay)
4.7/5 (29)
Which graph using individual data values instead of a process characteristic?
(Multiple Choice)
4.9/5 (31)
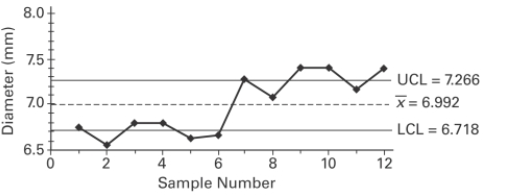
A control chart for is shown below. Determine whether the process mean is within statistical control. If it is not, identify which of the three out-of-control criteria lead to rejection of a statistically stable mean.
(Essay)
4.8/5 (38)
Consider process data consisting of the amounts of potato chips (in ounces) in randomly selected bags of chips. The process is to be monitored with control charts based on samples of 50 bags randomly selected each day for 15 consecutive days of production. What does denote?
(Multiple Choice)
4.8/5 (34)
Describe an R chart and give an example. What does it attempt to monitor?
(Essay)
4.9/5 (23)
Use the given process data to construct a control chart for p. A manufacturer monitors the level of defects in the television sets that it produces. Each week, 200 television sets are randomly
selected and tested and the number of defects is recorded. The results for 12 consecutive weeks
are shown below. 4 7 5 6 8 3 12 4 4 5 6 2
(Essay)
4.7/5 (26)
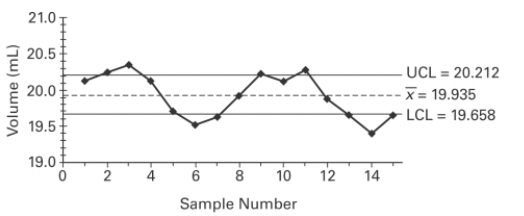
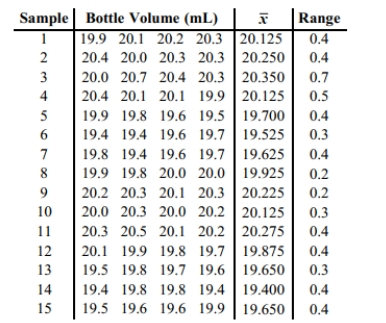
A machine that is supposed to fill small bottles to contain 20 milliliters yields the following data from a test of 4 bottles every hour. What would be the centerline for a control chart for ?
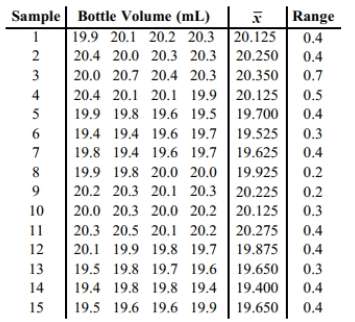
(Multiple Choice)
4.7/5 (28)
A control chart for is shown below. Determine whether the process mean is within statistical control. If it is not, identify which of the three out-of-control criteria lead to rejection of a statistically stable mean.
(Essay)
4.9/5 (36)
Construct an chart and determine whether the process variation is within statistical control.
 A machine that is supposed to fill small bottles to contain 20 milliliters yields the following data from a test of 4 bottles every hour.
(Essay)
4.9/5 (32)
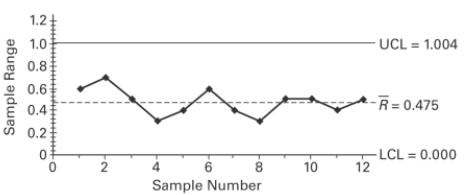
A control chart for is shown below. Determine whether the process variation is within statistical control. If it is not, identify which of the three out-of-control criteria lead to rejection of statistically stable variation.
(Essay)
4.9/5 (47)
_______________ measurement of a characteristic or good or services that result from some combination of equipment, people, materials, methods, and conditions.
(Multiple Choice)
4.9/5 (28)
A control chart for is shown below. Determine whether the process mean is within statistical control. If it is not, identify which of the three out-of-control criteria lead to rejection of a statistically stable mean.
(Essay)
4.9/5 (33)
Filters
- Essay(0)
- Multiple Choice(0)
- Short Answer(0)
- True False(0)
- Matching(0)