Exam 6: Normal Probability Distributions
Exam 1: Introduction to Statistics59 Questions
Exam 2: Exploring Data With Tables and Graphs59 Questions
Exam 3: Describing, Exploring, and Comparing Data59 Questions
Exam 4: Probability60 Questions
Exam 5: Discrete Probability Distributions59 Questions
Exam 6: Normal Probability Distributions60 Questions
Exam 7: Estimating Parameters and Determining Sample Sizes58 Questions
Exam 8: Hypothesis Testing57 Questions
Exam 9: Inferences From Two Samples58 Questions
Exam 10: Correlation and Regression56 Questions
Exam 11: Chi-Square and Analysis of Variance60 Questions
Exam 12: Statistical Control Charts, Nonparametric Tests, and Hypothesis Testing181 Questions
Select questions type
Estimate the indicated probability by using the normal distribution as an approximation to the binomial distribution. Estimate P(6)for n = 18 and p = 0.3.
(Multiple Choice)
4.9/5  (33)
(33)
Scores on a test are normally distributed with a mean of 63.2 and a standard deviation of 11.7 . Find which separates the bottom 81% from the top 19% .
(Multiple Choice)
4.7/5 (38)
If a histogram of a sample of men's ages is skewed, what do you expect to see in the normal quantile plot?
(Multiple Choice)
4.8/5 (36)
Three randomly selected households are surveyed as a pilot project for a larger survey to
be conducted later. The numbers of people in the households are 2, 3, and 8. Consider the
values of 2, 3, and 8 to be a population. Assume that samples of size n = 2 are randomly
selected with replacement from the population of 2, 3, and 8. The nine different samples are
as follows:
(2, 2), (2, 3), (2, 8), (3, 2), (3, 3), (3, 8), (8, 2), (8, 3), and (8, 8).
(i)Find the range of each of the nine samples, then summarize the sampling distribution of the
ranges in the format of a table representing the probability distribution. (ii)Compare the
population range to the mean of the sample ranges. (iii)Do the sample ranges target the value
of the population range? In general, do ranges make good estimators of population ranges?
Why or why not?
(Essay)
4.8/5 (38)
The heights of adult females are normally distributed. If you were to construct a histogram of 40 randomly selected women, what shape would the histogram of those heights have and what
Pattern would you expect in a normal quantile plot of these data?
(Multiple Choice)
4.8/5 (31)
You will use a normal distribution to approximate a binomial distribution. Complete the following table for a distribution in which It might be helpful to make a diagram to help you determine the continuity factor for each entry.
Find the probability that The continuity correction factor is: x is at least 12 x is at most 12 x is more than 12 x is less than 12
(Essay)
4.7/5 (41)
The given values are discrete. Use the continuity correction and describe the region of the normal distribution that corresponds to the indicated probability.
The probability of exactly 44 green marbles
(Multiple Choice)
4.9/5 (45)
Describe what an unbiased estimator is and give an example of an unbiased estimator and a
biased estimator.
(Essay)
4.8/5 (28)
Assume that z scores are normally distributed with a mean of 0 and a standard deviation of 1 . If find a .
(Multiple Choice)
4.7/5 (35)
The distribution of certain test scores is a nonstandard normal distribution with a mean of 50 and a standard deviation of 6 . What are the values of the mean and standard deviation after all test scores have been standardized by converting them to z -scores using
(Multiple Choice)
4.9/5 (31)
If z is a standard normal variable, find the probability that z lies between
(Multiple Choice)
4.8/5 (47)
A bank's loan officer rates applicants for credit. The ratings are normally distributed with a mean of 200 and a standard deviation of 50 . Find the score which separates the lower 60% from the top 40% .
(Multiple Choice)
4.8/5 (37)
For women aged 18-24, systolic blood pressures are normally distributed with a mean of 114.8 mm Hg and a standard deviation of 13.1 mm Hg. If 23 women aged 18-24 are randomly
Selected, find the probability that their mean systolic blood pressure is between 119 and 122
Mm Hg.
(Multiple Choice)
5.0/5 (43)
For the binomial distribution with n = 24 and p = 0.6, state whether or not it is suitable to use the normal distribution as an approximation.
(Multiple Choice)
4.9/5 (31)
Find the indicated z score. The graph depicts the standard normal distribution with mean 0 and standard deviation 1. Shaded area is 0.4483. 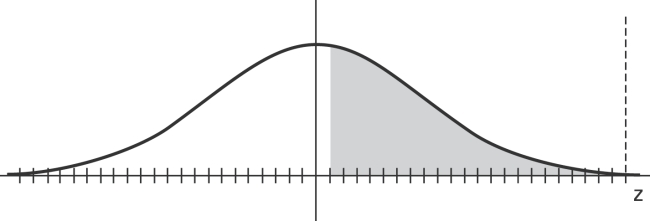
(Multiple Choice)
4.8/5 (48)
A normal quartile plot is given below for a sample of scores on an aptitude test. Use the
plot to assess the normality of scores on this test. Explain your reasoning. 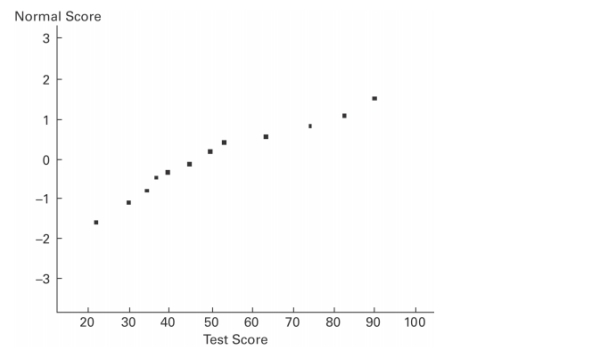
(Essay)
4.9/5 (39)
Identify three important criteria to determine if the use of a normal distribution is justified.
(Essay)
4.9/5 (43)
Assume that the red blood cell counts of women are normally distributed with a mean of 4.577 million cells per microliter and a standard deviation of 0.382 million cells per
Microliter. Find the value closest to the probability that a randomly selected woman has a red
Blood cell count above the normal range of 4.2 to 5.4 million cells per microliter.
(Multiple Choice)
4.8/5 (41)
A bank's loan officer rates applicants for credit. The ratings are normally distributed with a mean of 200 and a standard deviation of 50. If an applicant is randomly selected, find the
Probability of a rating that is between 200 and 275.
(Multiple Choice)
4.8/5 (40)
Filters
- Essay(0)
- Multiple Choice(0)
- Short Answer(0)
- True False(0)
- Matching(0)