Exam 4: Describing the Relation Between Two Variables
Exam 1: Data Collection113 Questions
Exam 2: Organizing and Summarizing Data82 Questions
Exam 3: Numerically Summarizing Data141 Questions
Exam 4: Describing the Relation Between Two Variables72 Questions
Exam 5: Probability257 Questions
Exam 6: Discrete Probability Distributions131 Questions
Exam 7: The Normal Probability Distribution120 Questions
Exam 8: Sampling Distributions52 Questions
Exam 9: Estimating the Value of a Parameter88 Questions
Exam 10: Hypothesis Tests Regarding a Parameter140 Questions
Exam 11: Inferences on Two Samples129 Questions
Exam 12: Inference on Categorical Data38 Questions
Exam 13: Comparing Three or More Means51 Questions
Select questions type
A manager wishes to determine the relationship between the number of miles (in hundreds of miles) themanagerʹs sales representatives travel per month and the amount of sales (in thousands of dollars) per month. Miles traveled, 2 3 10 7 8 15 3 1 11 Sales, 31 33 78 62 65 61 48 55 120
(Essay)
4.7/5  (32)
(32)
There is a strong positive correlation between years of education and births per woman. 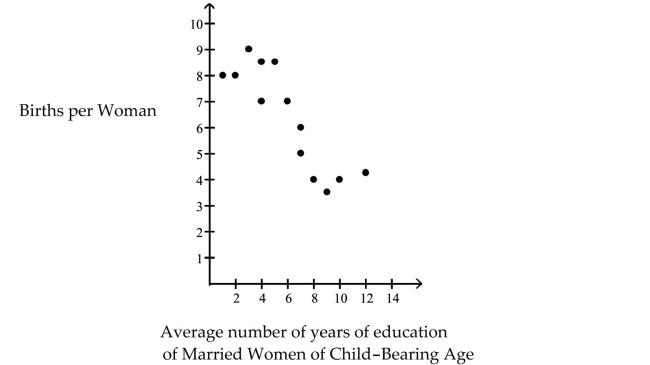
(True/False)
4.8/5 (32)
The data below are the ages and systolic blood pressures (measured in millimeters of mercury) of 9 randomlyselected adults. Age, x 38 41 45 48 51 53 57 61 65 Pressure, y 116 120 123 131 142 145 148 150 152
(Essay)
4.9/5 (30)
The data below are the ages and annual pharmacy b ills (in dollars) of 9 randomly selected employees.Calculate the linear correlation coefficient.
(Multiple Choice)
4.8/5 (36)
Calculate the linear correlation coefficient for the data below. -2 0 7 4 2 1 3 5 6 -1 15 10 -2 3 7 8 5 0 -1 12
(Multiple Choice)
4.9/5 (31)
The data below are the average one-way commute times (in minutes) for selected students and the number ofabsences for those students during the term. Find the equation of the regression line for the given data. Whatwould be the predicted number of absences if the commute time was 40 minutes? Is this a reasonable question?Round the predicted number of absences to the nearest whole number. Round the regression line values to thenearest hundredth. Commute time (min), 72 85 91 90 88 98 75 100 80 Number of absences. 3 7 10 10 8 15 4 15 5
(Multiple Choice)
4.7/5 (35)
The data below are the number of absences and the final grades of 9 randomly selected students from aliterature class. Find the equation of the regression line for the given data. What would be the predicted finalgrade if a student was absent 14 times? Round the regression line values to the nearest hundredth. Round thepredicted grade to the nearest whole number. Number of absences, 0 3 6 4 9 2 15 8 5 Final grade, 98 86 80 82 71 92 55 76 82
(Multiple Choice)
4.9/5 (35)
Five brands of cigarettes were tested for the amounts of tar and nicotine they contained. All measurements arein milligrams per cigarette. Cigarette Tar Nicotine Brand A 16 1.2 Brand B 13 1.1 Brand C 16 1.3 Brand D 18 1.4 Brand E 6 0.6
(Essay)
4.7/5 (35)
A manager wishes to determine whether there is a relationship between the number of years her salesrepresentatives have been with the company and their average monthly sales. The table shows the years ofservice for each of her sales representatives and their average monthly sales (in thousands of dollars). Years with company, x 6 7 14 11 12 19 7 5 15 Sales, y 36 38 83 67 70 66 53 60 125
(Multiple Choice)
4.7/5 (32)
In an area of the Great Plains, records were kept on the relationship between the rainfall (in inches) and theyield of wheat (bushels per acre). Calculate the linear correlation coefficient. Rainfall (in inches), 9.8 8.1 12.7 11.8 18.1 9.6 6.3 14.9 15.3 Yield (bushels per acre), y 48.5 44.2 56.8 57 80.4 47.2 29.9 74 76.8
(Multiple Choice)
4.8/5 (35)
Find the equation of the regression line for the given data. Round values to the nearest thousandth. -5 -3 4 1 -1 -2 0 2 3 -4 11 6 -6 -1 3 4 1 -4 -5 8
(Multiple Choice)
4.8/5 (37)
Filters
- Essay(0)
- Multiple Choice(0)
- Short Answer(0)
- True False(0)
- Matching(0)