Exam 4: Describing the Relation Between Two Variables
Exam 1: Data Collection113 Questions
Exam 2: Organizing and Summarizing Data82 Questions
Exam 3: Numerically Summarizing Data141 Questions
Exam 4: Describing the Relation Between Two Variables72 Questions
Exam 5: Probability257 Questions
Exam 6: Discrete Probability Distributions131 Questions
Exam 7: The Normal Probability Distribution120 Questions
Exam 8: Sampling Distributions52 Questions
Exam 9: Estimating the Value of a Parameter88 Questions
Exam 10: Hypothesis Tests Regarding a Parameter140 Questions
Exam 11: Inferences on Two Samples129 Questions
Exam 12: Inference on Categorical Data38 Questions
Exam 13: Comparing Three or More Means51 Questions
Select questions type
True or False: A doctor wishes to determine the relationship between a maleʹs age and that maleʹs totalcholesterol level. He tests 200 males and records each maleʹs age and that maleʹs total cholesterol level. Themales cholesterol level is the predictor variable?
(True/False)
4.8/5  (39)
(39)
Find the equation of the regression line for the given data. Round values to the nearest thousandth. -5 -3 4 1 -1 -2 0 2 3 -4 -10 -8 9 1 -2 -6 -1 3 6 -8
(Multiple Choice)
4.8/5 (29)
The data below are the final exam scores of 10 randomly selected history students and the number of hoursthey studied for the exam. Hours, 3 5 2 8 2 4 4 5 6 3 Scores, 65 80 60 88 66 78 85 90 90 71
(Essay)
4.9/5 (41)
The data below are the average one-way commute times (in minutes) of selected students during a summerliterature class and the number of absences for those students for the term. Calculate the linear correlationcoefficient. Commute time (min), 71 84 90 89 87 97 74 99 79 Number of absences, -1 3 6 6 4 11 0 11 1
(Multiple Choice)
4.7/5 (38)
Find the equation of the regression line by letting Row 1 represent the x-values and Row 2 represent they-values. Now find the equation of the regression line letting Row 2 represent the x-values and Row 1represent the y-values. What effect does switching the explanatory and response variables have on theregression line? Row 1 -5 -3 4 1 -1 -2 0 2 3 -4 Row 2 -10 -8 9 1 -2 -6 -1 3 6 -8
(Essay)
4.7/5 (35)
A history instructor has given the same pretest and the same final examination each semester. He is interestedin determining if there is a relationship between the scores of the two tests. He computes the linear correlationcoefficient and notes that it is 1.15. What does this correlation coefficient value tell the instructor?
(Multiple Choice)
4.8/5 (35)
The data below represent the numbers of absences and the final grades of 15 randomly selected students froman astronomy class. Construct a scatter diagram for the data. Do you detect a trend? Student Number of Absences Final Grade as a Percen 1 5 79 2 6 78 3 2 86 4 12 56 5 9 75 6 5 90 7 8 78 8 15 48 9 0 92 10 1 78 11 9 81 12 3 86 13 10 75 14 3 89 15 11 65
(Essay)
4.9/5 (39)
Subject A B C D E F G x Time watching TV 8 4 2 7 7 5 6 y Time on Internet 12 10 6 15 16 7 16
(Multiple Choice)
4.8/5 (28)
A manager wishes to determine the relationship between the number of years her sales representatives havebeen employed by the firm and their amount of sales (in thousands of dollars) per month. Find the equation ofthe regression line for the given data. What would be the predicted sales if the sales representative wasemployed by the firm for 30 years Is this reasonable? Why or why not? Round the regression line values to thenearest hundredth. Years employed, 2 3 10 7 8 15 3 1 11 Sales, 31 33 78 62 65 61 48 55 120
(Multiple Choice)
4.9/5 (33)
Which scatter diagram indicates a perfect positive correlation? 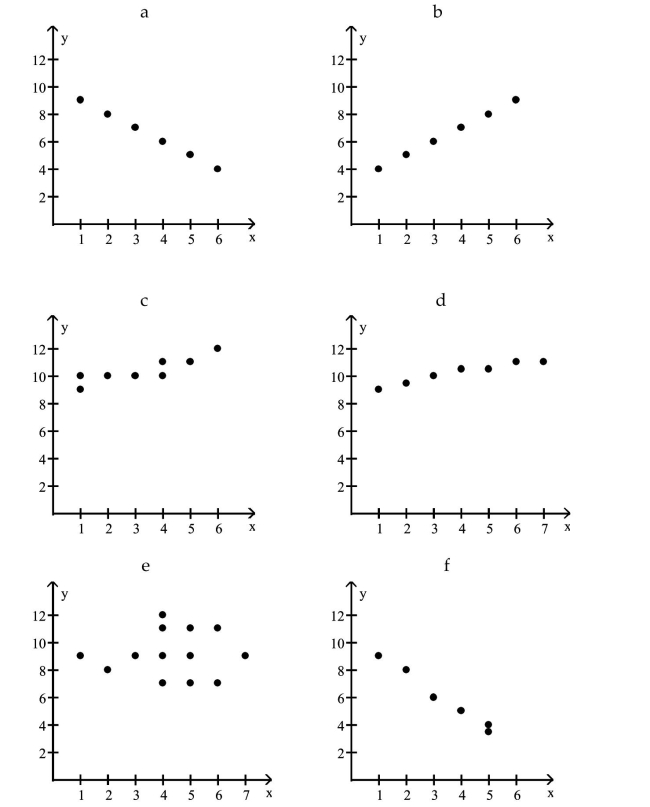
(Multiple Choice)
4.7/5 (27)
A random sample of 200 men aged between 20 and 60 was selected from a certain city. The linear correlationcoefficient between income and blood pressure was found to be r = 0.807. What does this imply? Does thissuggest that if a man gets a salary raise his blood pressure is likely to rise? Why or why not? What are likelylurking variables?4.2 Least-Squares Regression1 Find the least-squares regression line and use the line to make predictions.
(Essay)
4.8/5 (29)
Calculate the linear correlation coefficient for the data below. -9 -7 0 -3 -5 -6 -4 -2 -1 -8 16 -1 13 2 3 6 10 0 11 12
(Multiple Choice)
4.8/5 (34)
The data below are the number of absences and the final grades of 9 randomly selected students from aliterature class. Number of absences, 0 3 6 4 9 2 15 8 5 Final grade, 98 86 80 82 71 92 55 76 82
(Essay)
4.8/5 (35)
The data below are the final exam scores of 10 randomly selected calculus students and the number of hoursthey slept the night before the exam. Calculate the linear correlation coefficient. Hours, 4 6 3 9 3 5 5 6 7 4 Scores, 74 89 69 97 75 87 94 99 99 80
(Multiple Choice)
4.8/5 (38)
An instructor wishes to determine if there is a relationship between the number of absences from his class anda studentʹs final grade in the course. What is the predictor variable?
(Multiple Choice)
4.8/5 (31)
The numbers of home runs that Mark McGwire hit in the first 13 years of his major league baseball career arelisted below. (Source: Major League Handbook) Construct a scatter diagram for the data. Is there a relationshipbetween the home runs and the batting averages? Home Runs 33 39 22 42 9 9 39 52 58 70 Batting Average .231 .235 .201 .268 .33 .252 .274 .312 .274 .299
(Essay)
4.9/5 (26)
The table shows the number of days off last year and the earnings for the year (in thousands of dollars) for ninerandomly selected insurance salesmen. Number of days off, 0 3 6 4 9 2 15 8 5 Earnings for the year (thousands of dollars), 97 85 79 81 70 91 54 75 81
(Multiple Choice)
4.8/5 (30)
The data below are the final exam scores of 10 randomly selected history students and the number of hoursthey slept the night before the exam. Find the equation of the regression line for the given data. What would bethe predicted score for a history student who slept 7 hours the previous night? Is this a reasonable question?Round the regression line values to the nearest hundredth, and round the predicted score to the nearest wholenumber. Hours, 3 5 2 8 2 4 4 5 6 3 Scores, 65 80 60 88 66 78 85 90 90 71
(Multiple Choice)
4.8/5 (29)
A researcher determines that the linear correlation coefficient is 0.85 for a paired data set. This indicates thatthere is
(Multiple Choice)
4.7/5 (33)
Filters
- Essay(0)
- Multiple Choice(0)
- Short Answer(0)
- True False(0)
- Matching(0)