Exam 4: Describing the Relation Between Two Variables
Exam 1: Data Collection113 Questions
Exam 2: Organizing and Summarizing Data82 Questions
Exam 3: Numerically Summarizing Data141 Questions
Exam 4: Describing the Relation Between Two Variables72 Questions
Exam 5: Probability257 Questions
Exam 6: Discrete Probability Distributions131 Questions
Exam 7: The Normal Probability Distribution120 Questions
Exam 8: Sampling Distributions52 Questions
Exam 9: Estimating the Value of a Parameter88 Questions
Exam 10: Hypothesis Tests Regarding a Parameter140 Questions
Exam 11: Inferences on Two Samples129 Questions
Exam 12: Inference on Categorical Data38 Questions
Exam 13: Comparing Three or More Means51 Questions
Select questions type
The data below are the temperatures on randomly chosen days during a summer class and the number ofabsences on those days. Temperature, x 72 85 91 90 88 98 75 100 80 Number of absences, 3 7 10 10 8 15 4 15 5
(Essay)
4.9/5  (36)
(36)
In order for a companyʹs employees to work in a foreign office, they must take a test in the language of thecountry where they plan to work. The data below shows the relationship between the number of years thatemployees have studied a particular language and the grades they received on the proficiency exam. Calculatethe linear correlation coefficient. Number of years, x 7 8 8 9 7 10 6 11 7 Grades on test, y 62 69 76 83 74 91 59 94 73
(Multiple Choice)
4.9/5 (33)
To investigate the relationship between yield of soybeans and the amount of fertilizer used, a researcherdivides a field into eight plots of equal size and applies a different amount of fertilizer to each plot. The tableshows the yield of soybeans and the amount of fertilizer used for each plot. Amount of fertilizer (pounds) , 1 1.5 2 2.5 3 3.5 4 4.5 Yield of soybeans (pounds), 25 21 27 28 36 35 32 34
(Multiple Choice)
4.9/5 (36)
The variable is the variable whose value can be explained by the variable.
(Multiple Choice)
4.8/5 (33)
The table below shows the scores on an end-of-year project of 10 randomly selected architecture students andthe number of days each student spent working on the project. Days, 5 7 4 10 4 6 6 7 8 5 Score, 73 88 68 96 74 86 93 98 98 79
(Multiple Choice)
4.8/5 (35)
In an area of the Great Plains, records were kept on the relationship between the rainfall (in inches) and theyield of wheat (bushels per acre). Find the equation of the regression line for the given data. Round theregression line values to the nearest thousandth. Rainfall (in inches), 10.5 8.8 13.4 12.5 18.8 10.3 7.0 15.6 16.0 Vield (hushels ner acre) y 505 462 588 590 824 492 319 760 788
(Multiple Choice)
4.8/5 (39)
Calculate the coefficient of correlation, r, letting Row 1 represent the x-values and Row 2 represent they-values. Now calculate the coefficient of correlation, r, letting Row 2 represent the x-values and Row 1represent the y-values. What effect does switching the explanatory and response variables have on the linearcorrelation coefficient? Row 1 -10 -8 -1 -4 -6 -7 -5 -3 -2 -9 Row 2 0 18 19 11 8 4 9 13 16 18 4 Determine whether a linear relation exists between two variables.
(Essay)
4.8/5 (30)
A manager wishes to determine the relationship between the number of years the managerʹs salesrepresentatives have been with the company and their average monthly sales (in thousands of dollars).Calculate the linear correlation coefficient. Years with company, x 2 3 10 7 8 15 3 1 11 Sales, y 36 38 83 67 70 66 53 60 125
(Multiple Choice)
4.9/5 (37)
Construct a scatter diagram for the given data. Determine whether there is a positive linear correlation,negative linear correlation, or no linear correlation. -5 -3 4 1 -1 -2 0 2 3 -4 11 6 -6 -1 3 4 1 -4 -5 8
(Essay)
4.7/5 (38)
Calculate the linear correlation coefficient for the data below. -13 -11 -4 -7 -9 -10 -8 -6 -5 -12 -12 -10 7 -1 -4 -8 -3 1 4 -10
(Multiple Choice)
4.9/5 (42)
There is a strong negative correlation between years of education and births per woman. 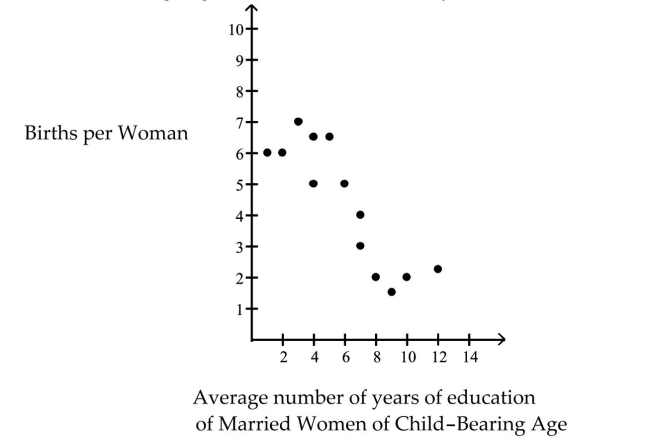
(True/False)
4.7/5 (32)
The table below shows the ages and weights (in pounds) of 9 randomly selected tennis coaches. Age, 36 39 43 46 49 51 55 59 63 Weight (pounds), 112 116 119 127 138 141 144 146 148
(Multiple Choice)
4.9/5 (31)
Construct a scatter diagram for the given data. Determine whether there is a positive linear correlation,negative linear correlation, or no linear correlation. -5 -3 4 1 -1 -2 0 2 3 -4 11 -6 8 -3 -2 1 5 -5 6 7
(Essay)
4.8/5 (34)
For a random sample of 100 American cities, the linear correlation coefficient between the number of robberieslast year and the number of schools in the city was found to be r = 0.725. What does this imply? Does thissuggest that building more schools in a city could lead to more robberies? Why or why not? What is a likelylurking variable?
(Essay)
4.9/5 (38)
The data below are ages and systolic blood pressures (measured in millimeters of mercury) of 9 randomlyselected adults. Find the equation of the regression line for the given data. What would be the predictedpressure if the age was 60? Round the predicted pressure to the nearest whole number. Round the regressionline values to the nearest hundredth. Age, 38 41 45 48 51 53 57 61 65 Pressure, 116 120 123 131 142 145 148 150 152
(Multiple Choice)
4.9/5 (38)
In an area of the Great Plains, records were kept on the relationship between the rainfall (in inches) and theyield of wheat (bushels per acre). Rainfall (in inches), x 10.5 8.8 13.4 12.5 18.8 10.3 7.0 15.6 16.0 Yield (bushels per acre), y 50.5 46.2 58.8 59.0 82.4 49.2 31.9 76.0 78.8
(Essay)
4.8/5 (33)
Filters
- Essay(0)
- Multiple Choice(0)
- Short Answer(0)
- True False(0)
- Matching(0)