Exam 2: Organizing and Summarizing Data
Exam 1: Data Collection113 Questions
Exam 2: Organizing and Summarizing Data82 Questions
Exam 3: Numerically Summarizing Data141 Questions
Exam 4: Describing the Relation Between Two Variables72 Questions
Exam 5: Probability257 Questions
Exam 6: Discrete Probability Distributions131 Questions
Exam 7: The Normal Probability Distribution120 Questions
Exam 8: Sampling Distributions52 Questions
Exam 9: Estimating the Value of a Parameter88 Questions
Exam 10: Hypothesis Tests Regarding a Parameter140 Questions
Exam 11: Inferences on Two Samples129 Questions
Exam 12: Inference on Categorical Data38 Questions
Exam 13: Comparing Three or More Means51 Questions
Select questions type
A researcher records the number of employees of each of the IT companies in the town of Westmoore. Theresults are summarized in the table. Number of Employees Number of IT Companies 0-399 36 400-799 22 800-1199 9 1200-1599 6 1600-1999 7 Find the class limits of the third class.
(Multiple Choice)
4.9/5  (31)
(31)
A random sample of 30 high school students is selected. Each student is asked how much time he or she spenton the Internet during the previous week. The following times (in hours) are obtained: 14 22 16 19 16 14 16 15 13 19
17 15 15 14 17 16 13 13 18 15
14 22 16 19 16 14 16 15 13 19 17 15 15 14 17 16 13 13 18 15 13 15 22 17 14 18 14 17 16 15
13 15 22 17 14 18 14 17 16 15 Construct a frequency distribution for the data.
(Essay)
5.0/5 (38)
Height (in inches) Frequency 50-52 5 53-55 8 56-58 12 59-61 13 62-64 11
(Essay)
4.8/5 (31)
The bar graph below shows the political party affiliation of 1000 registered U.S. voters. What percentage of the1000 registered U.S. voters belonged to one of the traditional two parties (Democratic and Republican)? 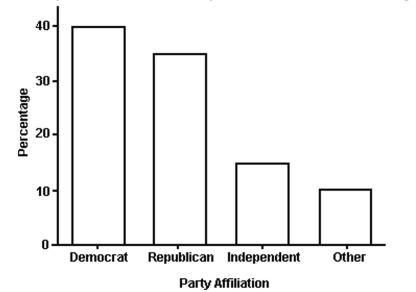
(Multiple Choice)
4.7/5 (36)
Student Council President 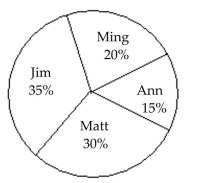 700 total votesWho got the most votes?
(Multiple Choice)
4.8/5 (39)
The preschool children at Elmwood Elementary School were asked to name their favorite color. The results arelisted below. Construct a frequency distribution and a relative frequency distribution. yellow yellow blue purple red red red yellow red blue red blue purple purple purple blue red purple red green
(Essay)
4.8/5 (29)
Use the following frequency distribution to determine the class limits of the third class. Class Frequency 9-11 7 12-14 11 15-17 8 18-20 5 21-23 9 24-26 6
(Multiple Choice)
4.8/5 (35)
The data set: ages of dishwashers (in years) in 20 randomly selected households 12 6 4 9 11 1 7 8 9 8 9 13 5 15 7 6 8 8 2 1
(Multiple Choice)
4.9/5 (29)
A researcher records the number of employees of each of the IT companies in the town of Westmoore. Theresults are summarized in the table. Number of Employees Number of IT Companies 0-749 30 750-1499 24 1500-2249 6 2250-2999 5 3000-3749 5 Find the class width.
(Multiple Choice)
4.7/5 (36)
The table below summarizes the weights of the almonds (in grams) in a one-pound bag. What is the classwidth? Weight () Frequency 0.7585-0.8184 1 0.8185-0.8784 1 0.8785-0.9384 1 0.9385-0.9984 3 0.9985-1.0584 157 1.0585-1.1184 171 1.1185-1.1784 8
(Multiple Choice)
4.8/5 (38)
The grade point averages for 40 evening students are listed below. Construct a frequency polygon using eightclasses. 2.0 3.2 1.8 2.9 0.9 4.0 3.3 2.9 3.6 0.8 3.1 2.4 2.4 2.3 1.6 1.6 4.0 3.1 3.2 1.8 2.2 2.2 1.7 0.5 3.6 3.4 1.9 2.0 3.0 1.1 3.0 4.0 4.0 2.1 1.9 1.1 0.5 3.2 3.0 2.2
(Essay)
4.8/5 (33)
What is the difference between a bar chart and a histogram?
(Multiple Choice)
4.9/5 (38)
The local police, using radar, checked the speeds (in mph) of 30 motorists in a construction area. The results arelisted below. Construct a frequency distribution, a relative frequency distribution, a cumulative frequencydistribution, and a relative cumulative frequency distribution using six classes. 44 38 41 50 36 36 43 42 49 48 35 40 37 41 43 50 45 45 39 38 50 41 47 36 35 40 42 43 48 33 3 Construct frequency and relative frequency ogives.
(Essay)
4.8/5 (41)
The data below represent the consumption of high-energy drinks (in gallons) by adult Americans over anine-year period. Year 1 2 3 4 5 6 7 8 9 Consumption (gal) 10 11 11 12 13 14 15 15 13
(Essay)
4.8/5 (34)
Student Council President 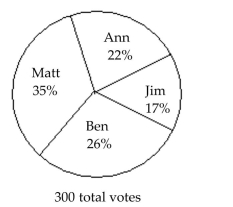 What percent of the votes did Jim and Ann receive together?
(Multiple Choice)
4.9/5 (32)
Women were allowed to enter the Boston Marathon for the first time in 1972. Listed below are the winningwomenʹs times (in minutes) for the first 10 years. Year 1 2 3 4 5 6 7 8 9 10 Time 190 186 167 162 167 168 165 155 154 147 2.4 Graphical Misrepresentations of Data1 Describe what can make a graph misleading or deceptive.
(Essay)
4.9/5 (37)
The grade point averages for 40 evening students are listed below. Construct a frequency ogive usingeight classes. 2.0 3.2 1.8 2.9 0.9 4.0 3.3 2.9 3.6 0.8 3.1 2.4 2.4 2.3 1.6 1.6 4.0 3.1 3.2 1.8 2.2 2.2 1.7 0.5 3.6 3.4 1.9 2.0 3.0 1.1 3.0 4.0 4.0 2.1 1.9 1.1 0.5 3.2 3.0 2.2
(Essay)
4.7/5 (40)
Filters
- Essay(0)
- Multiple Choice(0)
- Short Answer(0)
- True False(0)
- Matching(0)