Exam 2: Organizing and Summarizing Data
Exam 1: Data Collection113 Questions
Exam 2: Organizing and Summarizing Data82 Questions
Exam 3: Numerically Summarizing Data141 Questions
Exam 4: Describing the Relation Between Two Variables72 Questions
Exam 5: Probability257 Questions
Exam 6: Discrete Probability Distributions131 Questions
Exam 7: The Normal Probability Distribution120 Questions
Exam 8: Sampling Distributions52 Questions
Exam 9: Estimating the Value of a Parameter88 Questions
Exam 10: Hypothesis Tests Regarding a Parameter140 Questions
Exam 11: Inferences on Two Samples129 Questions
Exam 12: Inference on Categorical Data38 Questions
Exam 13: Comparing Three or More Means51 Questions
Select questions type
A transportation engineer wishes to use the following data to illustrate the number of deaths from the collisionof passenger cars with motorcycles on a particular highway. Year Number of Deaths 1 12 2 17 3 22 4 21 5 16 6 13 7 11
(Essay)
4.9/5  (39)
(39)
For the stem-and-leaf plot below, what are the maximum and minimum entries? 1 05 1 666789 2 0112344566 2 77788999 3 011234455 3 66678899 4 09
(Multiple Choice)
5.0/5 (36)
A two-pound bag of assorted candy contained 100 caramels, 83 mint patties, 93 chocolate squares, 80 nutclusters, and 79 peanut butter taffy pieces. To create a pie chart of this data, the angle for the slice representingeach candy type must be computed. What is the degree measure of the slice representing the mint pattiesrounded to the nearest degree?
(Multiple Choice)
4.8/5 (27)
The Excel frequency bar graph below describes the employment status of a random sample of U.S. adults.What is the percentage of those having no job? 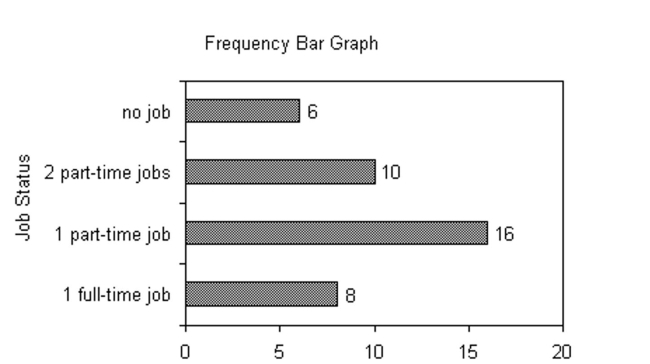
(Multiple Choice)
5.0/5 (34)
The heights (in inches) of 30 mechanics are listed below. Construct a dot plot for the data. 70 72 71 70 69 73 69 68 70 71
67 71 70 74 69 68 71 71 71 72
69 71 68 67 73 74 70 71 69 68 7 Identify the shape of a distribution.
(Essay)
4.9/5 (38)
The local police, using radar, checked the speeds (in mph) of 30 motorists at a busy intersection. The results arelisted below. Construct a dot plot for the data. 44 38 41 50 36 36 43 42 49 48 35 40 37 41 43 50 45 45 39 38 50 41 47 36 35 40 42 43 48 33
(Essay)
4.9/5 (30)
The grade point averages for 40 evening students are listed below. Construct a relative frequency ogive usingeight classes. 2.0 3.2 1.8 2.9 0.9 4.0 3.3 2.9 3.6 0.8 3.1 2.4 2.4 2.3 1.6 1.6 4.0 3.1 3.2 1.8 2.2 2.2 1.7 0.5 3.6 3.4 1.9 2.0 3.0 1.1 3.0 4.0 4.0 2.1 1.9 1.1 0.5 3.2 3.0 2.2
(Essay)
4.8/5 (37)
The results of a survey about a recent judicial appointment are given in the table below. Construct a relativefrequency distribution. Response Frequency Strongly Favor 25 Favor 26 Neutral 8 Oppose 22 Strongly Oppose 119
(Essay)
4.8/5 (38)
Student Council President 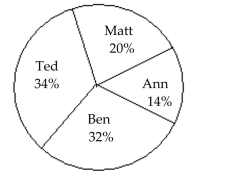 400 total votesWho got the fewest votes?
(Multiple Choice)
4.8/5 (35)
A sample of 25 service project scores is taken and is recorded below. Construct a frequency distribution for thisdata. 97 96 96 95 96
99 97 97 100 99
95 98 95 96 100
95 98 96 96 100
95 97 99 97 98 2 Construct histograms of discrete data.
(Essay)
4.8/5 (28)
Find the class width for the frequency table below. Class Frequency 31-32 3 33-34 1 35-36 3 37-38 6 39-40 2
(Multiple Choice)
4.8/5 (24)
A sample of 15 Girl Scouts was selected and their weights (in pounds) were recorded. The results are listedbelow. Construct a frequency histogram for the data using a class width of 10 and using 95 as the lower limitof the first class. 97 120 137 124 117 108 134 126 123 106 130 110 100 120 140
(Essay)
4.8/5 (36)
The grade point averages for 40 evening students are listed below. Construct a frequency bar graph and arelative frequency bar graph. Grade Point Average Frequency 0.5-0.9 4 1.0-1.4 2 1.5-1.9 7 2.0-2.4 9 2.5-2.9 2 3.0-3.4 10 3.5-3.9 2 4.0-4.4 4
(Essay)
4.8/5 (36)
The 30 students in Mrs Harrisonʹs literature class were asked how many cousins they had. The results areshown below. Create a frequency histogram for the data using a class width of 2. 10 1 3 5 4 7 5 1 0 9 11 1 5 4 1 7 7 11 0 6 6 1 5 7 10 1 1 5 6 0
(Essay)
4.7/5 (33)
A study was conducted to determine how people get jobs. Four hundred subjects were randomly selected andthe results are listed below. Round percents to whole numbers. Job Sources of Survey Respondents Frequency Newspaper want ads 72 Online services 124 Executive search firms 69 Mailings 32 Networking 103
(Essay)
4.8/5 (32)
The numbers of runs batted in by Mark McLemore in the first 13 years of his major league baseball career arelisted below. (Source: Major League Handbook) Construct a stem-and-leaf plot for this data. 0 102 56 25 9 9 56 165 88 122 150 91 114
(Essay)
4.8/5 (30)
Filters
- Essay(0)
- Multiple Choice(0)
- Short Answer(0)
- True False(0)
- Matching(0)