Exam 13: Methods for Quality Improvement: Statistical Process Control Available on CD
Exam 1: Statistics, Data, and Statistical Thinking74 Questions
Exam 2: Methods for Describing Sets of Data188 Questions
Exam 3: Probability237 Questions
Exam 4: Random Variables and Probability Distributions273 Questions
Exam 5: Sampling Distributions52 Questions
Exam 6: Inferences Based on a Single Sample: Estimation With Confidence Intervals135 Questions
Exam 7: Inferences Based on a Single Sample: 355 Tests of Hypotheses144 Questions
Exam 8: Inferences Based on Two Samples: Confidence Intervals and Tests of Hypotheses102 Questions
Exam 9: Design of Experiments and Analysis of Variance87 Questions
Exam 10: Categorical Data Analysis59 Questions
Exam 11: Simple Linear Regression113 Questions
Exam 12: Multiple Regression and Model Building131 Questions
Exam 13: Methods for Quality Improvement: Statistical Process Control Available on CD89 Questions
Exam 14: Time Series: Descriptive Analyses, Models, and Forecasting Available on CD73 Questions
Exam 15: Nonparametric Statistics Available on CD49 Questions
Select questions type
The upper and lower control limits are usually a distance of _______ from the centerline.
(Multiple Choice)
4.8/5  (45)
(45)
The capability index for a process centered on the desired mean is
(Multiple Choice)
4.8/5 (31)
(Situation E) A machine at K-Company fills boxes with bran flake cereal. The target weight for the filled boxes is 24
ounces. The company would like to use control charts to monitor the performance of the machine. The company decides
to sample and weigh 10 consecutive boxes of cereal at randomly selected times over a two-week period. Twenty
measurement times are selected and the following information is recorded. Time Mean (oz) Range (oz) Time Mean (oz) Range (oz) 1 23.8 1.05 11 24.5 1.21 2 24.5 0.85 12 24.7 0.65 3 23.9 1.12 13 24.0 0.55 4 24.2 0.95 14 25.5 3.21 5 23.7 1.22 15 24.2 1.25 6 23.5 1.42 16 24.4 1.35 7 24.2 1.02 17 24.5 0.98 8 24.4 1.10 18 25.0 1.30 9 24.1 0.75 19 24.1 0.88 10 24.2 0.60 20 24.2 1.01
-Calculate the centerline for constructing the
(Short Answer)
4.9/5 (34)
The centerline of a control chart is drawn at the level of the median of the sample.
(True/False)
4.7/5 (32)
(Situation A) To construct a p-chart for a manufacturing process, 20 samples of size 100 were selected. The results areshown below:
Sample Sample Size Defectives Sample Sample Size Defectives 1 100 10 11 100 8 2 100 8 12 100 8 3 100 9 13 100 5 4 100 6 14 100 9 5 100 7 15 100 7 6 100 3 16 100 9 7 100 8 17 100 11 8 100 6 18 100 4 9 100 11 19 100 6 10 100 10 20 100 8
-Calculate the centerline used in constructing a p-chart.
(Multiple Choice)
4.7/5 (45)
Performance, reliability, and durability are some of the factors used to evaluate quality.
(True/False)
4.8/5 (41)
(Situation E) A machine at K-Company fills boxes with bran flake cereal. The target weight for the filled boxes is 24 ounces. The company would like to use control charts to monitor the performance of the machine. The company decides to sample and weigh 10 consecutive boxes of cereal at randomly selected times over a two-week period. Twenty measurement times are selected and the following information is recorded. Time Mean (oz) Range (oz) Time Mean (oz) Range (oz) 1 23.8 1.05 11 24.5 1.21 2 24.5 0.85 12 24.7 0.65 3 23.9 1.12 13 24.0 0.55 4 24.2 0.95 14 25.5 3.21 5 23.7 1.22 15 24.2 1.25 6 23.5 1.42 16 24.4 1.35 7 24.2 1.02 17 24.5 0.98 8 24.4 1.10 18 25.0 1.30 9 24.1 0.75 19 24.1 0.88 10 24.2 0.60 20 24.2 1.01
-
(Essay)
4.8/5 (32)
The elimination of common causes of variation is typically the responsibility of workers, not management.
(True/False)
4.8/5 (35)
If we are unable to conclude that the process is out of control, it is better to behave as if the process were under control than to tamper with the process.
(True/False)
4.7/5 (39)
With rare exceptions, all items produced by a process are identical.
(True/False)
4.9/5 (32)
Control charts are the tool of choice for continuously monitoring processes.
(True/False)
4.8/5 (29)
An in-control, centered process that follows a normal distribution has a of 3.0. How many standard deviations away from the process mean is the upper specification limit?
(Multiple Choice)
4.8/5 (33)
(Situation D) A walk-in freezer thermostat at a restaurant is set at 5°F. Because of the perishability of the food in the freezer, the restaurant manager has decided to begin monitoring the temperature inside the freezer. The managers used a precision thermometer to take sample temperature readings at five randomly chosen times per day for 10 days. The data are presented below.
1 5.22 5.29 5.11 4.95 4.78 2 4.40 4.41 4.63 6.03 4.83 3 5.11 5.43 4.90 4.55 5.23 4 5.65 4.24 5.09 4.82 5.50 5 4.68 5.92 4.71 4.67 4.75 6 5.01 5.26 6.10 5.20 5.25 7 5.20 4.99 5.15 5.96 5.35 8 4.30 4.91 5.03 4.97 4.80 9 5.45 5.62 6.11 5.13 4.90 10 5.06 5.13 4.95 5.59 5.80
-Calculate the centerline of the R-chart.
(Essay)
4.9/5 (39)
(Situation B) A manufacturing company makes hemostats for hospital emergency rooms. The company is interested in implementing statistical process control procedures in its production operation. The production manager believes that the proportion of defective hemostats generated by the process is about 3%. The company collected one sample of 300 consecutively manufactured hemostats each day for 20 days.
The data are shown below.
Sample Sample Size Defectives Sample Sample Size Defectives 1 300 8 11 300 12 2 300 6 12 300 11 3 300 11 13 300 14 4 300 15 14 300 8 5 300 12 15 300 7 6 300 11 16 300 3 7 300 9 17 300 9 8 300 6 18 300 11 9 300 5 19 300 10 10 300 4 20 300 6
-Construct the p-chart and interpret it.
(Essay)
4.8/5 (42)
Does the following control chart represent a process that is in control or out of control? If it is out of control, explain how you arrived at this conclusion. 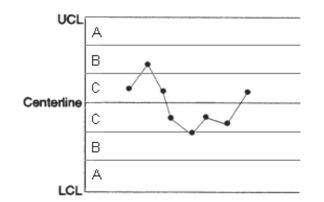
(Short Answer)
4.8/5 (35)
(Situation E) A machine at K-Company fills boxes with bran flake cereal. The target weight for the filled boxes is 24 ounces. The company would like to use control charts to monitor the performance of the machine. The company decides to sample and weigh 10 consecutive boxes of cereal at randomly selected times over a two-week period. Twenty measurement times are selected and the following information is recorded. Time Mean (oz) Range (oz) Time Mean (oz) Range (oz) 1 23.8 1.05 11 24.5 1.21 2 24.5 0.85 12 24.7 0.65 3 23.9 1.12 13 24.0 0.55 4 24.2 0.95 14 25.5 3.21 5 23.7 1.22 15 24.2 1.25 6 23.5 1.42 16 24.4 1.35 7 24.2 1.02 17 24.5 0.98 8 24.4 1.10 18 25.0 1.30 9 24.1 0.75 19 24.1 0.88 10 24.2 0.60 20 24.2 1.01
-Calculate the centerline of the
(Essay)
4.9/5 (34)
Control limits and specification limits are essentially the same thing.
(True/False)
4.9/5 (34)
Filters
- Essay(0)
- Multiple Choice(0)
- Short Answer(0)
- True False(0)
- Matching(0)