Exam 13: Methods for Quality Improvement: Statistical Process Control Available on CD
Exam 1: Statistics, Data, and Statistical Thinking74 Questions
Exam 2: Methods for Describing Sets of Data188 Questions
Exam 3: Probability237 Questions
Exam 4: Random Variables and Probability Distributions273 Questions
Exam 5: Sampling Distributions52 Questions
Exam 6: Inferences Based on a Single Sample: Estimation With Confidence Intervals135 Questions
Exam 7: Inferences Based on a Single Sample: 355 Tests of Hypotheses144 Questions
Exam 8: Inferences Based on Two Samples: Confidence Intervals and Tests of Hypotheses102 Questions
Exam 9: Design of Experiments and Analysis of Variance87 Questions
Exam 10: Categorical Data Analysis59 Questions
Exam 11: Simple Linear Regression113 Questions
Exam 12: Multiple Regression and Model Building131 Questions
Exam 13: Methods for Quality Improvement: Statistical Process Control Available on CD89 Questions
Exam 14: Time Series: Descriptive Analyses, Models, and Forecasting Available on CD73 Questions
Exam 15: Nonparametric Statistics Available on CD49 Questions
Select questions type
(Situation C) Ten samples of were collected to construct an -chart. The sample means and ranges for the 10 samples are shown below.
Sample Mean Range Sample Mean Range 1 20.2 2.7 6 20.4 1.9 2 22.4 1.8 7 15.9 1.0 3 21.2 1.5 8 22.3 2.1 4 18.2 1.2 9 20.7 1.6 5 23.2 2.4 10 21.1 1.8
-Calculate the centerline for constructing the
(Essay)
4.9/5  (34)
(34)
The upper and lower control limits are positioned so that when the process is in control the probability of an individual value of the output variable falling outside the control limits is very large.
(True/False)
4.8/5 (28)
Does the following control chart represent a process that is in control or out of control? If it
is out of control, explain how you arrived at this conclusion. 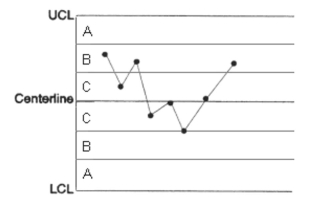
(Short Answer)
4.9/5 (44)
(Situation D) A walk-in freezer thermostat at a restaurant is set at 5°F. Because of the perishability of the food in the freezer, the restaurant manager has decided to begin monitoring the temperature inside the freezer. The managers used a precision thermometer to take sample temperature readings at five randomly chosen times per day for 10 days. The data are presented below.
1 5.22 5.29 5.11 4.95 4.78 2 4.40 4.41 4.63 6.03 4.83 3 5.11 5.43 4.90 4.55 5.23 4 5.65 4.24 5.09 4.82 5.50 5 4.68 5.92 4.71 4.67 4.75 6 5.01 5.26 6.10 5.20 5.25 7 5.20 4.99 5.15 5.96 5.35 8 4.30 4.91 5.03 4.97 4.80 9 5.45 5.62 6.11 5.13 4.90 10 5.06 5.13 4.95 5.59 5.80
-Create the R-chart and interpret it.
(Essay)
5.0/5 (50)
(Situation B) A manufacturing company makes hemostats for hospital emergency rooms. The company is interested in implementing statistical process control procedures in its production operation. The production manager believes that the proportion of defective hemostats generated by the process is about 3%. The company collected one sample of 300 consecutively manufactured hemostats each day for 20 days. The data are shown below. Sample Sample Size Defectives Sample Sample Size Defectives 1 300 8 11 300 12 2 300 6 12 300 11 3 300 11 13 300 14 4 300 15 14 300 8 5 300 12 15 300 7 6 300 11 16 300 3 7 300 9 17 300 9 8 300 6 18 300 11 9 300 5 19 300 10 10 300 4 20 300 6
-Find the upper and lower control limits for the p-chart.
(Essay)
4.7/5 (35)
A process may be in control but still not be capable of producing output that is acceptable to customers.
(True/False)
4.9/5 (38)
(Situation F) Ten samples of were collected to construct an -chart. The sample means and ranges for the 10 samples are shown below.
Sample Mean Range Sample Mean Range 1 20.2 2.7 6 20.4 1.9 2 22.4 1.8 7 15.9 1.0 3 21.2 1.5 8 22.3 2.1 4 18.2 1.2 9 20.7 1.6 5 23.2 2.4 10 21.1 1.8
-Calculate the centerline of the
(Multiple Choice)
4.8/5 (31)
(Situation A) To construct a p-chart for a manufacturing process, 20 samples of size 100 were selected. The results are shown below: Sample Sample Size Defectives Sample Sample Size Defectives 1 100 10 11 100 8 2 100 8 12 100 8 3 100 9 13 100 5 4 100 6 14 100 9 5 100 7 15 100 7 6 100 3 16 100 9 7 100 8 17 100 11 8 100 6 18 100 4 9 100 11 19 100 6 10 100 10 20 100 8
-Calculate the upper and lower control limits for the p-chart.
(Multiple Choice)
4.9/5 (41)
If a capability analysis study indicates that an in-control process is not capable, it is usually off-centeredness, rather than variation, that is the culprit.
(True/False)
4.7/5 (37)
The quality of a product is indicated by the extent to which it satisfies the needs and preferences of its manufacturer.
(True/False)
4.8/5 (32)
A process is in control and has a normally distributed output distribution with mean of 1000 and a standard deviation of 100. The upper and lower specification limits for the process are 1060 and 940, respectively. Assuming no changes in the behavior of the process, what percentage of the
Output will be unacceptable?
(Multiple Choice)
4.7/5 (46)
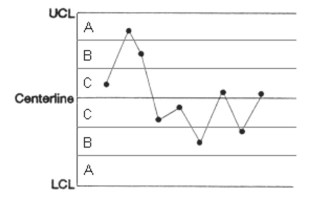
Does the following control chart represent a process that is in control or out of control? If it is out of control, explain how you arrived at this conclusion.
(Short Answer)
4.8/5 (30)
If one or more values fall outside the control limits, then either a rare event has occurred or the process is out of control.
(True/False)
4.9/5 (35)
The variation in the output of processes that are out of control can be entirely attributed to random behavior.
(True/False)
4.9/5 (35)
(Situation E) A machine at K-Company fills boxes with bran flake cereal. The target weight for the filled boxes is 24 ounces. The company would like to use control charts to monitor the performance of the machine. The company decides to sample and weigh 10 consecutive boxes of cereal at randomly selected times over a two-week period. Twenty measurement times are selected and the following information is recorded. Time Mean (oz) Range (oz) Time Mean (oz) Range (oz) 1 23.8 1.05 11 24.5 1.21 2 24.5 0.85 12 24.7 0.65 3 23.9 1.12 13 24.0 0.55 4 24.2 0.95 14 25.5 3.21 5 23.7 1.22 15 24.2 1.25 6 23.5 1.42 16 24.4 1.35 7 24.2 1.02 17 24.5 0.98 8 24.4 1.10 18 25.0 1.30 9 24.1 0.75 19 24.1 0.88 10 24.2 0.60 20 24.2 1.01
-Does the following control chart represent a process that is in control or out of control? If it is out of control, explain how you arrived at this conclusion. 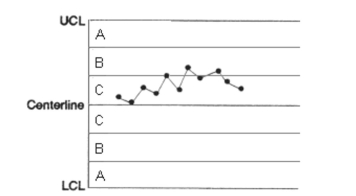
(Essay)
4.8/5 (35)
Control charts may only be used for quantitative quality variables.
(True/False)
4.9/5 (46)
If all points fall between the control limits, then we may safely conclude that the process is in statistical control.
(True/False)
4.8/5 (36)
Filters
- Essay(0)
- Multiple Choice(0)
- Short Answer(0)
- True False(0)
- Matching(0)