Exam 2: Linear and Quadratic Functions
Exam 1: Functions and Their Graphs297 Questions
Exam 2: Linear and Quadratic Functions302 Questions
Exam 3: Polynomial and Rational Functions354 Questions
Exam 4: Exponential and Logarithmic Functions517 Questions
Exam 5: Trigonometric Functions354 Questions
Exam 6: Analytic Trigonometry342 Questions
Exam 7: Applications of Trigonometric Functions105 Questions
Exam 8: Polar Coordinates; Vectors253 Questions
Exam 9: Analytic Geometry200 Questions
Exam 10: Systems of Equations and Inequalities235 Questions
Exam 11: Sequences; Induction; the Binomial Theorem238 Questions
Exam 12: Counting and Probability115 Questions
Exam 13: A Preview of Calculus: the Limit, Derivative, and Integral of a Function145 Questions
Exam 14: Foundations: a Prelude to Functions234 Questions
Exam 15: Graphing Utilities29 Questions
Select questions type
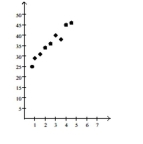
Use a graphing utility to find the equation of the line of best fit. Round to two decimal places, if necessary.
-Ten students in a graduate program were randomly selected. Their grade point averages (GPAs) when they entered the program were between 3.5 and 4.0. The following data were obtained regarding their GPAs on entering the program
Versus their current GPAs. Entering GPA Current GPA 3.5 3.6 3.8 3.7 3.6 3.9 3.6 3.6 3.5 3.9 3.9 3.8 4.0 3.7 3.9 3.9 3.5 3.8 3.7 4.0
(Multiple Choice)
5.0/5  (29)
(29)
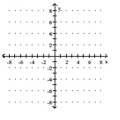
Graph the function. State whether it is increasing, decreasing, or constant..
-
(Multiple Choice)
4.7/5 (29)
Use a graphing utility to find the equation of the line of best fit. Round to two decimal places, if necessary.
- 24 26 28 30 32 15 13 20 16 24
(Multiple Choice)
4.8/5 (35)
Use a graphing utility to find the equation of the line of best fit. Round to two decimal places, if necessary.
- 1.2 1.4 1.6 1.8 2.0 54 53 55 54 56
(Multiple Choice)
4.9/5 (41)
Find the real zeros, if any, of each quadratic function using the quadratic formula. List the x-intercepts, if any, of the
graph of the function.
-
(Multiple Choice)
4.8/5 (31)
Find the real zeros of the function. List the x-intercepts of the graph of the function.
-
(Multiple Choice)
4.8/5 (36)
Solve the problem.
-A flare fired from the bottom of a gorge is visible only when the flare is above the rim. If it is fired with an initial velocity of , and the gorge is deep, during what interval can the flare be seen?
(Multiple Choice)
4.7/5 (42)
Graph the function using its vertex, axis of symmetry, and intercepts.
-
(Multiple Choice)
4.8/5 (32)
Solve the problem.
-Marty's Tee Shirt & Jacket Company is to produce a new line of jackets with a embroidery of a Great Pyrenees dog on the front. There are fixed costs of $650 to set up for production, and variable costs of $39 per jacket. Write
An equation that can be used to determine the total cost, C(x), encountered by Marty's Company in producing x
Jackets, and use the equation to find the total cost of producing 79 jackets.
(Multiple Choice)
4.9/5 (38)
Determine the average rate of change for the function.
-F(x) = -5
(Multiple Choice)
4.8/5 (34)
employees each year.
Choose the one alternative that best completes the statement or answers the question.
Use factoring to find the zeros of the quadratic function. List the x-intercepts of the graph of the function.
-
(Multiple Choice)
4.8/5 (36)
Solve the problem.
-If a polygon, of sides has diagonals, how many sides will a polygon with 189 diagonals have?
(Multiple Choice)
4.8/5 (35)
Use a graphing calculator to plot the data and find the quadratic function of best fit.
-Southern Granite and Marble sells granite and marble by the square yard. One of its granite patterns is price sensitive. If the price is too low, customers perceive that it has less quality. If the price is too high, customers
Perceive that it is overpriced. The company conducted a pricing test with potential customers. The following
Data was collected. Use a graphing calculator to plot the data. What is the quadratic function of best fit? Price, x Buyers, B \ 20 30 \ 30 50 \ 40 65 \ 60 75 \ 80 72 \ 100 50 \ 110 25
(Multiple Choice)
4.9/5 (41)
Write the word or phrase that best completes each statement or answers the question.
-The following scatter diagram shows heights (in inches) of children and their ages.
 \ Age (years) Based on this data, how old do you think a child is who is about 39 inches tall?
(Multiple Choice)
4.9/5 (36)
Solve the inequality. Express your answer using interval notation. Graph the solution set.
-
(Multiple Choice)
4.8/5 (30)
Solve the problem.
-The price and the quantity sold of a certain product obey the demand equation
What quantity maximizes revenue? What is the maximum revenue?
(Multiple Choice)
4.9/5 (32)
Filters
- Essay(0)
- Multiple Choice(0)
- Short Answer(0)
- True False(0)
- Matching(0)